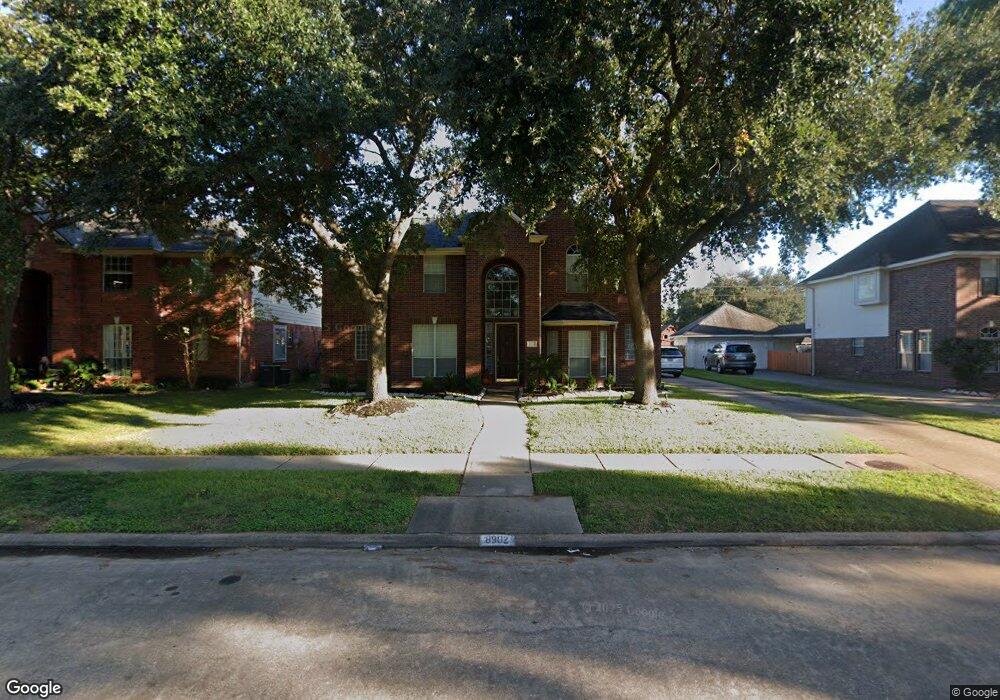
8902 Bonnyview Dr Houston, TX 77095
Estimated Value: $384,000 - $415,000
4
Beds
4
Baths
2,801
Sq Ft
$142/Sq Ft
Est. Value
About This Home
This home is located at 8902 Bonnyview Dr, Houston, TX 77095 and is currently estimated at $398,735, approximately $142 per square foot. 8902 Bonnyview Dr is a home located in Harris County with nearby schools including Fiest Elementary School, Labay Middle School, and Cypress Falls High School.
Ownership History
Date
Name
Owned For
Owner Type
Purchase Details
Closed on
Jul 11, 2016
Sold by
Mccraw John G and Mccraw Danielle R
Bought by
Duong Van
Current Estimated Value
Purchase Details
Closed on
Jul 16, 2001
Sold by
Schumacher Matthew A P and Soldano Carla
Bought by
Mccraw John G and Mccraw Danielle R
Home Financials for this Owner
Home Financials are based on the most recent Mortgage that was taken out on this home.
Original Mortgage
$150,300
Interest Rate
7.2%
Purchase Details
Closed on
Jan 24, 1996
Sold by
George Wimpey Of Texas Inc
Bought by
Schumacher Matthew A P and Soldano Carla
Home Financials for this Owner
Home Financials are based on the most recent Mortgage that was taken out on this home.
Original Mortgage
$109,800
Interest Rate
7.19%
Create a Home Valuation Report for This Property
The Home Valuation Report is an in-depth analysis detailing your home's value as well as a comparison with similar homes in the area
Home Values in the Area
Average Home Value in this Area
Purchase History
| Date | Buyer | Sale Price | Title Company |
|---|---|---|---|
| Duong Van | -- | None Available | |
| Mccraw John G | -- | Charter Title Company | |
| Schumacher Matthew A P | -- | American Title Co |
Source: Public Records
Mortgage History
| Date | Status | Borrower | Loan Amount |
|---|---|---|---|
| Previous Owner | Mccraw John G | $150,300 | |
| Previous Owner | Schumacher Matthew A P | $109,800 |
Source: Public Records
Tax History Compared to Growth
Tax History
| Year | Tax Paid | Tax Assessment Tax Assessment Total Assessment is a certain percentage of the fair market value that is determined by local assessors to be the total taxable value of land and additions on the property. | Land | Improvement |
|---|---|---|---|---|
| 2025 | $5,178 | $352,151 | $84,438 | $267,713 |
| 2024 | $5,178 | $387,608 | $70,438 | $317,170 |
| 2023 | $5,178 | $333,140 | $70,438 | $262,702 |
| 2022 | $6,754 | $312,113 | $53,375 | $258,738 |
| 2021 | $6,499 | $250,825 | $53,375 | $197,450 |
| 2020 | $6,632 | $245,685 | $44,188 | $201,497 |
| 2019 | $6,838 | $245,922 | $43,313 | $202,609 |
| 2018 | $2,342 | $234,535 | $43,313 | $191,222 |
| 2017 | $6,163 | $220,412 | $43,313 | $177,099 |
| 2016 | $6,163 | $220,412 | $43,313 | $177,099 |
| 2015 | $4,416 | $205,018 | $43,313 | $161,705 |
| 2014 | $4,416 | $194,260 | $43,313 | $150,947 |
Source: Public Records
Map
Nearby Homes
- 15906 Marwick Ct
- 8818 Apple Mill Dr
- 15802 Aberdeen Trails Dr
- 8814 Sherina Park Dr
- 15735 Jamie Lee Dr
- 9138 Shango Ln
- 16111 Aberdeen Forest Dr
- 9111 Sunny Ridge Dr
- 16123 Aberdeen Forest Dr
- 9303 Reston Grove Ln
- 8526 Greenleaf Lake Dr
- 15627 Kentwater Ct
- 15610 Manorford Ct
- 8550 Sparkling Springs Dr
- 15954 Oak Mountain Dr
- 16211 Green Smoke Dr
- 15610 Tarpon Springs Ct
- 15634 Haleys Landing Ln
- 8835 Aberdeen Park Dr
- 8306 Lake Crystal Dr
- 8818 Bonnyview Dr
- 8906 Bonnyview Dr
- 8814 Bonnyview Dr
- 8910 Bonnyview Dr
- 15903 Marwick Ct
- 8919 Apple Mill Dr
- 15902 Blaire Ct
- 8915 Apple Mill Dr
- 8923 Apple Mill Dr
- 8810 Bonnyview Dr
- 8914 Bonnyview Dr
- 8911 Apple Mill Dr
- 15911 Marwick Ct
- 15906 Blaire Ct
- 8907 Apple Mill Dr
- 15902 Marwick Ct
- 8931 Apple Mill Dr
- 8806 Bonnyview Dr
- 8918 Bonnyview Dr
- 8903 Apple Mill Dr