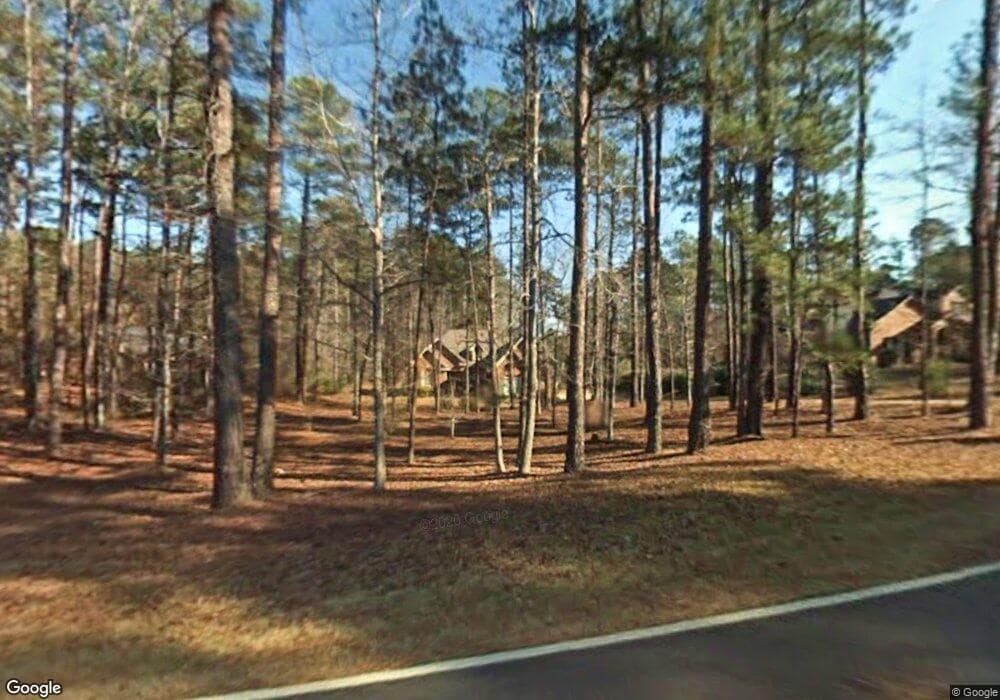
8902 Moore Rd Columbus, GA 31904
North Columbus NeighborhoodEstimated Value: $437,098 - $525,000
4
Beds
4
Baths
2,855
Sq Ft
$170/Sq Ft
Est. Value
About This Home
This home is located at 8902 Moore Rd, Columbus, GA 31904 and is currently estimated at $486,525, approximately $170 per square foot. 8902 Moore Rd is a home located in Muscogee County with nearby schools including Double Churches Elementary School, Veterans Memorial Middle School, and Northside High School.
Ownership History
Date
Name
Owned For
Owner Type
Purchase Details
Closed on
Dec 20, 2010
Sold by
Reigel Scott Joel
Bought by
Reigel Scott J and Reigel Tandy Kern
Current Estimated Value
Home Financials for this Owner
Home Financials are based on the most recent Mortgage that was taken out on this home.
Original Mortgage
$338,400
Outstanding Balance
$7,322
Interest Rate
3.72%
Mortgage Type
New Conventional
Estimated Equity
$479,203
Purchase Details
Closed on
Aug 28, 2007
Sold by
Smith Steven and Mccown Alice
Bought by
Royster Charles T and Royster Patsy
Home Financials for this Owner
Home Financials are based on the most recent Mortgage that was taken out on this home.
Original Mortgage
$228,865
Interest Rate
6.7%
Mortgage Type
Purchase Money Mortgage
Create a Home Valuation Report for This Property
The Home Valuation Report is an in-depth analysis detailing your home's value as well as a comparison with similar homes in the area
Home Values in the Area
Average Home Value in this Area
Purchase History
| Date | Buyer | Sale Price | Title Company |
|---|---|---|---|
| Reigel Scott J | -- | None Available | |
| Royster Charles T | $322,000 | None Available |
Source: Public Records
Mortgage History
| Date | Status | Borrower | Loan Amount |
|---|---|---|---|
| Open | Reigel Scott J | $338,400 | |
| Closed | Royster Charles T | $228,865 |
Source: Public Records
Tax History
| Year | Tax Paid | Tax Assessment Tax Assessment Total Assessment is a certain percentage of the fair market value that is determined by local assessors to be the total taxable value of land and additions on the property. | Land | Improvement |
|---|---|---|---|---|
| 2025 | $3,835 | $147,576 | $32,756 | $114,820 |
| 2024 | $3,833 | $147,576 | $32,756 | $114,820 |
| 2023 | $328 | $147,576 | $32,756 | $114,820 |
| 2022 | $4,028 | $135,716 | $32,756 | $102,960 |
| 2021 | $4,021 | $123,132 | $32,756 | $90,376 |
| 2020 | $4,022 | $123,132 | $32,756 | $90,376 |
| 2019 | $4,039 | $123,132 | $32,756 | $90,376 |
| 2018 | $4,039 | $123,132 | $32,756 | $90,376 |
| 2017 | $4,056 | $123,132 | $32,756 | $90,376 |
| 2016 | $4,074 | $128,745 | $12,000 | $116,745 |
| 2015 | $1,632 | $128,745 | $12,000 | $116,745 |
| 2014 | $1,635 | $128,745 | $12,000 | $116,745 |
| 2013 | -- | $128,745 | $12,000 | $116,745 |
Source: Public Records
Map
Nearby Homes
- 8935 A N Moore Rd
- 8530 Lake Bright Dr
- 8531 Lake Bright Dr
- 0 Biggers Rd Unit 226758
- 1801 Biggers Rd
- 8511 Lake Bright Dr
- 994 Timber Creek Way
- 8782 Creekrise Dr
- 8785 Creekrise Dr
- 6712 Bridge Way
- 6742 Bridge Way
- 8809 Creekrise Dr
- 8817 Creekrise Dr
- 8825 Creekrise Dr
- 7841 Edgewater Dr
- 281 Zachary Ct
- 8026 Splendor Way
- 517 Double Churches Rd
- Lot 52 Creekrise Dr
- Lot 53 Creekrise Dr
- 8910 Moore Rd
- 8894 Moore Rd
- 8912 & 8912a Moore's Chapel Rd
- 8839 Moore Rd Unit L
- 8930 Moore Rd
- 8886 Moore Rd
- 8901 Moore Rd
- 8909 Moore Rd
- 8919 Moore Rd
- 8929 Moore Rd
- 8940 Moore Rd
- 8821 Greenleaf Dr
- 8878 Moore Rd
- 8889 Moore Rd
- 8939 Moore Rd
- 8946 Moore Rd
- 8831 Greenleaf Dr
- 8811 Greenleaf Dr
- 8968 Moore Rd
- 8959 Moore Rd
Your Personal Tour Guide
Ask me questions while you tour the home.