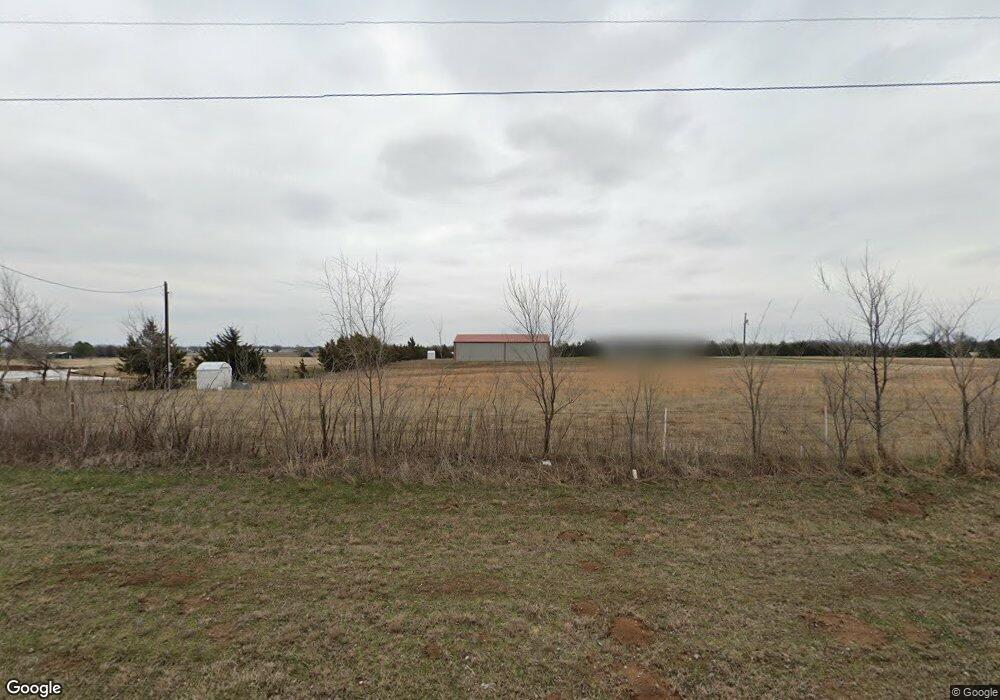
890238 S 3472 Rd Chandler, OK 74834
Estimated Value: $193,000 - $269,000
3
Beds
2
Baths
1,612
Sq Ft
$143/Sq Ft
Est. Value
About This Home
This home is located at 890238 S 3472 Rd, Chandler, OK 74834 and is currently estimated at $230,708, approximately $143 per square foot. 890238 S 3472 Rd is a home with nearby schools including Davenport Elementary School and Davenport High School.
Ownership History
Date
Name
Owned For
Owner Type
Purchase Details
Closed on
May 28, 2019
Sold by
Mascho Douglas M and Mascho Heather D
Bought by
Mascho Douglas M and Mascho Heather D
Current Estimated Value
Home Financials for this Owner
Home Financials are based on the most recent Mortgage that was taken out on this home.
Original Mortgage
$40,000
Outstanding Balance
$21,230
Interest Rate
4.2%
Mortgage Type
Stand Alone Second
Estimated Equity
$209,478
Purchase Details
Closed on
Jul 14, 2008
Sold by
Mascho Robert G and Mascho Jewelene M
Bought by
Mascho Douglas M
Create a Home Valuation Report for This Property
The Home Valuation Report is an in-depth analysis detailing your home's value as well as a comparison with similar homes in the area
Home Values in the Area
Average Home Value in this Area
Purchase History
| Date | Buyer | Sale Price | Title Company |
|---|---|---|---|
| Mascho Douglas M | -- | Covius Settlement Svcs Llc | |
| Mascho Douglas M | -- | None Available |
Source: Public Records
Mortgage History
| Date | Status | Borrower | Loan Amount |
|---|---|---|---|
| Open | Mascho Douglas M | $40,000 |
Source: Public Records
Tax History Compared to Growth
Tax History
| Year | Tax Paid | Tax Assessment Tax Assessment Total Assessment is a certain percentage of the fair market value that is determined by local assessors to be the total taxable value of land and additions on the property. | Land | Improvement |
|---|---|---|---|---|
| 2025 | $1,202 | $14,243 | $1,672 | $12,571 |
| 2024 | $1,202 | $12,425 | $2,603 | $9,822 |
| 2023 | $1,202 | $22,282 | $2,603 | $19,679 |
| 2022 | $861 | $13,034 | $1,502 | $11,532 |
| 2021 | $1,079 | $12,654 | $1,627 | $11,027 |
| 2020 | $1,038 | $12,286 | $1,301 | $10,985 |
| 2019 | $1,031 | $11,928 | $1,371 | $10,557 |
| 2018 | $976 | $11,581 | $1,309 | $10,272 |
| 2017 | $966 | $11,243 | $1,479 | $9,764 |
| 2016 | $949 | $10,916 | $1,258 | $9,658 |
| 2015 | $832 | $10,598 | $1,066 | $9,532 |
| 2014 | $852 | $10,289 | $629 | $9,660 |
Source: Public Records
Map
Nearby Homes