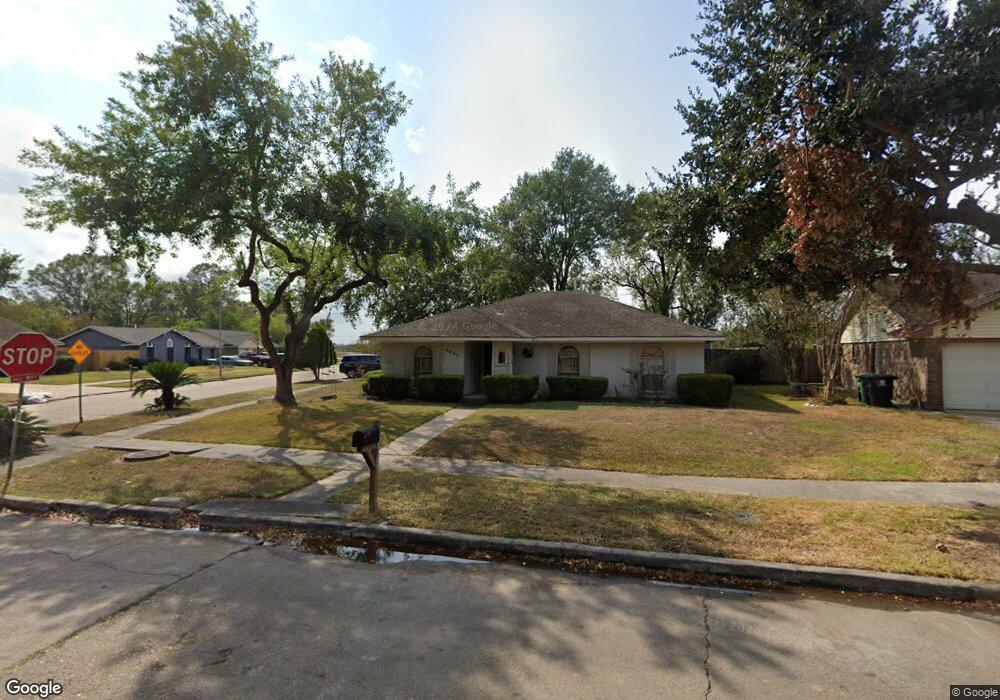
8903 Langfield Rd Houston, TX 77040
Greater Inwood NeighborhoodEstimated Value: $223,036 - $238,000
3
Beds
2
Baths
1,464
Sq Ft
$158/Sq Ft
Est. Value
About This Home
This home is located at 8903 Langfield Rd, Houston, TX 77040 and is currently estimated at $231,509, approximately $158 per square foot. 8903 Langfield Rd is a home located in Harris County with nearby schools including Holbrook Elementary School, Dean Middle School, and Jersey Village High School.
Ownership History
Date
Name
Owned For
Owner Type
Purchase Details
Closed on
Oct 27, 2014
Sold by
Wasson Donald Randolph
Bought by
Felipe Laudelino R and Cash Elvia Y
Current Estimated Value
Home Financials for this Owner
Home Financials are based on the most recent Mortgage that was taken out on this home.
Original Mortgage
$10,400
Interest Rate
4.16%
Mortgage Type
New Conventional
Purchase Details
Closed on
Dec 11, 2007
Sold by
Silva Juventino S and Silva Blanca N
Bought by
Felipe Laudelino R and Felipe Elvia Y
Home Financials for this Owner
Home Financials are based on the most recent Mortgage that was taken out on this home.
Original Mortgage
$116,550
Interest Rate
6.23%
Mortgage Type
Seller Take Back
Purchase Details
Closed on
Nov 28, 1995
Sold by
Fairbanks Rebekah Lodge #151
Bought by
Silva Juventino S and Silva Blanca
Purchase Details
Closed on
Apr 13, 1995
Sold by
Steinbis Martin T and Steinbis Susan E
Bought by
Silva Juventino S and Silva Blanca N
Create a Home Valuation Report for This Property
The Home Valuation Report is an in-depth analysis detailing your home's value as well as a comparison with similar homes in the area
Home Values in the Area
Average Home Value in this Area
Purchase History
| Date | Buyer | Sale Price | Title Company |
|---|---|---|---|
| Felipe Laudelino R | -- | American Title Co | |
| Felipe Laudelino R | -- | Chicago Title | |
| Silva Juventino S | -- | Stewart Title | |
| Silva Juventino S | -- | American Title Company |
Source: Public Records
Mortgage History
| Date | Status | Borrower | Loan Amount |
|---|---|---|---|
| Closed | Felipe Laudelino R | $10,400 | |
| Previous Owner | Felipe Laudelino R | $116,550 |
Source: Public Records
Tax History Compared to Growth
Tax History
| Year | Tax Paid | Tax Assessment Tax Assessment Total Assessment is a certain percentage of the fair market value that is determined by local assessors to be the total taxable value of land and additions on the property. | Land | Improvement |
|---|---|---|---|---|
| 2025 | $2,766 | $195,720 | $67,586 | $128,134 |
| 2024 | $2,766 | $205,980 | $67,586 | $138,394 |
| 2023 | $2,766 | $206,891 | $67,586 | $139,305 |
| 2022 | $1,634 | $185,554 | $56,442 | $129,112 |
| 2021 | $3,998 | $154,719 | $56,442 | $98,277 |
| 2020 | $3,903 | $155,296 | $39,325 | $115,971 |
| 2019 | $3,693 | $133,855 | $23,595 | $110,260 |
| 2018 | $1,036 | $121,147 | $23,595 | $97,552 |
| 2017 | $3,355 | $121,147 | $23,595 | $97,552 |
| 2016 | $3,192 | $117,728 | $23,595 | $94,133 |
| 2015 | $1,944 | $111,498 | $19,663 | $91,835 |
| 2014 | $1,944 | $95,251 | $19,663 | $75,588 |
Source: Public Records
Map
Nearby Homes
- 7259 Shady Arbor Ln
- 7318 Shady Grove Ln
- 7218 Stonegate Dr
- 8615 Black Tern Ln
- 9331 Deanwood St
- 7718 Breezeway St
- 9350 Guywood St
- 9207 Loren Ln
- 8610 Twillingate Ln
- 6902 Anson Point Ln
- 8007 E Oakwood Ct
- 9214 Woodland Oaks Dr
- 8020 Oakwood Forest Dr
- 9523 Vanwood St
- 7731 Deadwood Dr
- 6819 Oakwood Grove
- 7123 Shady Vale Ln
- 6407 Deirdre Anne Dr
- 7706 Deadwood Dr
- 7051 Majestic Oaks Dr
- 8907 Langfield Rd
- 8911 Langfield Rd
- 7403 Shady Arbor Ln
- 7407 Shady Arbor Ln
- 8906 Langfield Rd
- 8915 Langfield Rd
- 7411 Shady Arbor Ln
- 7335 Shady Arbor Ln
- 8914 Langfield Rd
- 7331 Shady Arbor Ln
- 7402 Woodfern Dr
- 7406 Woodfern Dr
- 8919 Langfield Rd
- 7410 Woodfern Dr
- 7326 Shady Arbor Ln
- 7330 Woodfern Dr
- 8918 Langfield Rd
- 7327 Shady Arbor Ln
- 7414 Woodfern Dr
- 9003 Langfield Rd