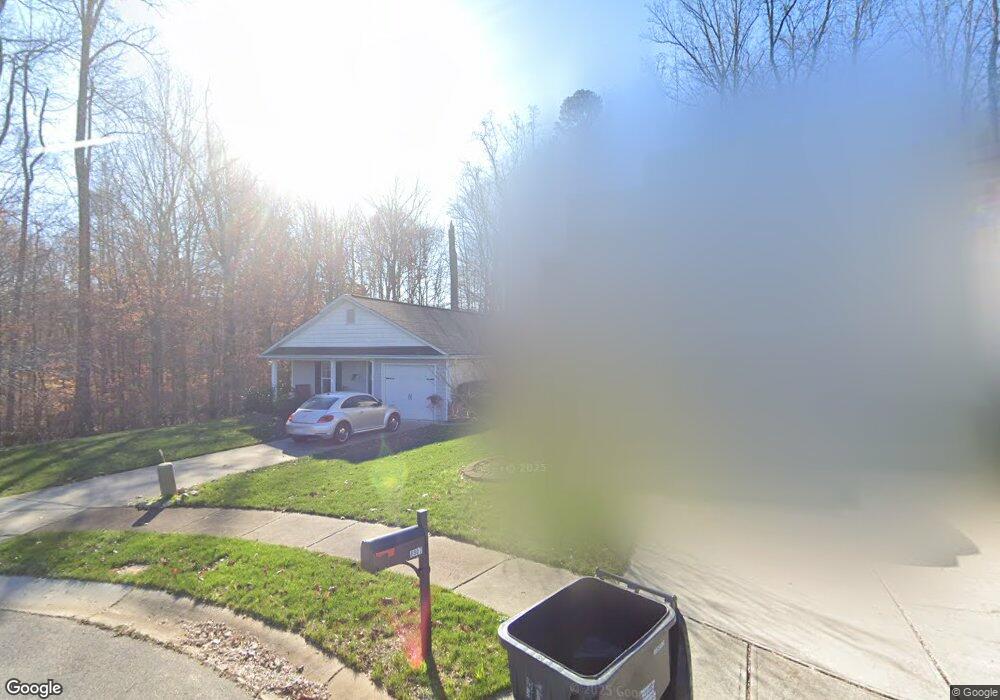
8903 Mcadam Way Charlotte, NC 28269
West Sugar Creek NeighborhoodEstimated Value: $288,000 - $332,000
3
Beds
2
Baths
1,338
Sq Ft
$229/Sq Ft
Est. Value
About This Home
This home is located at 8903 Mcadam Way, Charlotte, NC 28269 and is currently estimated at $305,961, approximately $228 per square foot. 8903 Mcadam Way is a home with nearby schools including David Cox Road Elementary, Ridge Road Middle School, and Mallard Creek High School.
Ownership History
Date
Name
Owned For
Owner Type
Purchase Details
Closed on
Jul 9, 2015
Sold by
Wade Jurney Homes Inc
Bought by
Arrington Teresa C
Current Estimated Value
Home Financials for this Owner
Home Financials are based on the most recent Mortgage that was taken out on this home.
Original Mortgage
$112,759
Interest Rate
5%
Mortgage Type
FHA
Purchase Details
Closed on
Feb 12, 2015
Sold by
J & E Land Holding Company Llc
Bought by
Wade Jurney Homes Inc
Purchase Details
Closed on
Nov 3, 2009
Sold by
C P Morgan Communities Of Charlotte Llc
Bought by
J & E Land Holding Company Llc
Purchase Details
Closed on
Mar 14, 2007
Sold by
The Ryland Group Inc
Bought by
C P Morgan Communities Of Charlotte Llc
Purchase Details
Closed on
Mar 30, 2006
Sold by
Edgefield Subdivision Llc
Bought by
The Ryland Group Inc
Create a Home Valuation Report for This Property
The Home Valuation Report is an in-depth analysis detailing your home's value as well as a comparison with similar homes in the area
Home Values in the Area
Average Home Value in this Area
Purchase History
| Date | Buyer | Sale Price | Title Company |
|---|---|---|---|
| Arrington Teresa C | $115,000 | None Available | |
| Wade Jurney Homes Inc | $17,000 | None Available | |
| J & E Land Holding Company Llc | $1,099,500 | None Available | |
| C P Morgan Communities Of Charlotte Llc | $550,000 | None Available | |
| The Ryland Group Inc | $139,500 | None Available |
Source: Public Records
Mortgage History
| Date | Status | Borrower | Loan Amount |
|---|---|---|---|
| Previous Owner | Arrington Teresa C | $112,759 |
Source: Public Records
Tax History Compared to Growth
Tax History
| Year | Tax Paid | Tax Assessment Tax Assessment Total Assessment is a certain percentage of the fair market value that is determined by local assessors to be the total taxable value of land and additions on the property. | Land | Improvement |
|---|---|---|---|---|
| 2025 | $2,505 | $310,600 | $70,000 | $240,600 |
| 2024 | $2,505 | $310,600 | $70,000 | $240,600 |
| 2023 | $2,417 | $310,600 | $70,000 | $240,600 |
| 2022 | $1,793 | $172,800 | $30,000 | $142,800 |
| 2021 | $1,782 | $172,800 | $30,000 | $142,800 |
| 2020 | $1,775 | $172,800 | $30,000 | $142,800 |
| 2019 | $1,759 | $172,800 | $30,000 | $142,800 |
| 2018 | $1,248 | $89,500 | $17,500 | $72,000 |
| 2017 | $1,221 | $89,500 | $17,500 | $72,000 |
| 2016 | $1,212 | $17,500 | $17,500 | $0 |
| 2015 | $227 | $17,500 | $17,500 | $0 |
| 2014 | $225 | $17,500 | $17,500 | $0 |
Source: Public Records
Map
Nearby Homes
- 9413 Munsing Dr
- 9400 Munsing Dr Unit 147
- 9404 Munsing Dr
- 9404 Munsing Dr Unit 148
- 9412 Munsing Dr Unit 150
- 9416 Munsing Dr Unit 151
- 9420 Munsing Dr
- 5034 Glenwalk Dr Unit 22
- Wynn Plan at Griffith Lakes - Waterstone Collection
- Ronelle Plan at Griffith Lakes - Waterstone Collection
- Nora Plan at Griffith Lakes - Waterstone Collection
- Dilworth Plan at Griffith Lakes - Cottage Collection
- Westview Plan at Griffith Lakes - Cottage Collection
- Dean Plan at Griffith Lakes - Cottage Collection
- Woodrow Plan at Griffith Lakes - Cottage Collection
- Badin Plan at Griffith Lakes - Preserve Collection
- William Plan at Griffith Lakes - Preserve Collection
- Trawick Plan at Griffith Lakes - Cottage Collection
- Devin Plan at Griffith Lakes - Preserve Collection
- Tahoma Plan at Griffith Lakes - Preserve Collection
- 8907 Mcadam Way
- 8911 Mcadam Way
- 8915 Mcadam Way
- 8919 Mcadam Way
- 8904 Mcadam Way
- 8910 Mcadam Way
- 8927 Mcadam Way
- 5101 Burnaby Ct
- 8900 Old Potters Rd
- 5116 Burnaby Ct
- 5105 Burnaby Ct
- 5105 Burnaby Ct Unit 47
- 8931 Mcadam Way
- 5109 Burnaby Ct
- 5120 Burnaby Ct
- 8935 Mcadam Way
- 5113 Burnaby Ct
- 8940 Mcadam Way
- 5126 Burnaby Ct
- 5117 Burnaby Ct