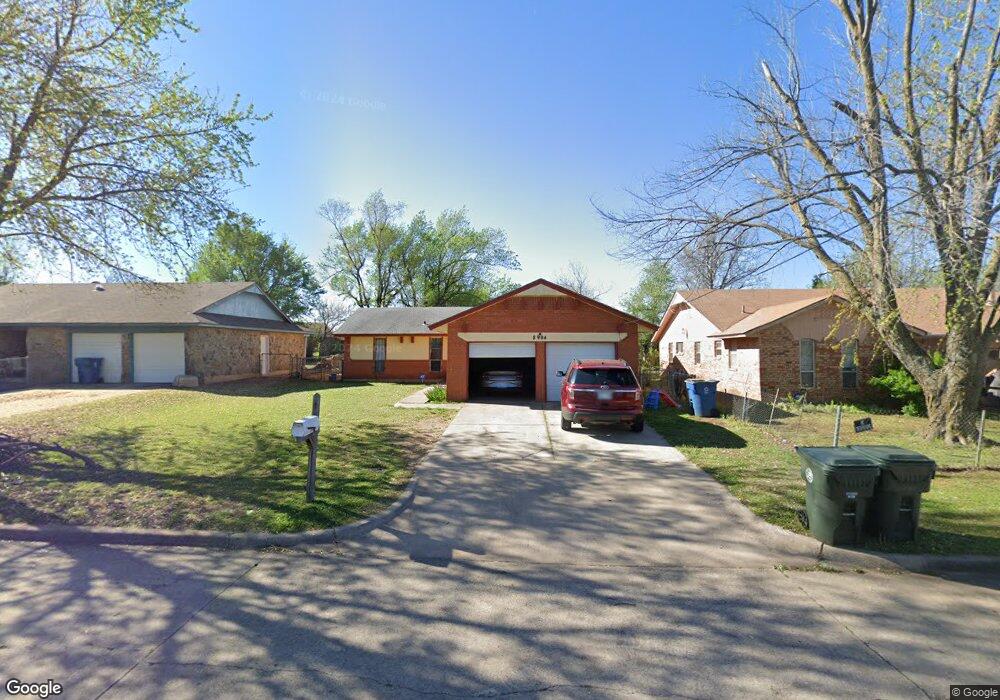
8904 NE 13th St Oklahoma City, OK 73110
Estimated Value: $113,000 - $143,000
3
Beds
2
Baths
998
Sq Ft
$127/Sq Ft
Est. Value
About This Home
This home is located at 8904 NE 13th St, Oklahoma City, OK 73110 and is currently estimated at $126,995, approximately $127 per square foot. 8904 NE 13th St is a home located in Oklahoma County with nearby schools including Willow Brook Elementary School, Star Spencer Mid-High School, and Insight School of Oklahoma High School.
Ownership History
Date
Name
Owned For
Owner Type
Purchase Details
Closed on
Dec 8, 2021
Sold by
Equity Trust Company
Bought by
Equity Trust Company and Patricia Hoskins Ira
Current Estimated Value
Home Financials for this Owner
Home Financials are based on the most recent Mortgage that was taken out on this home.
Original Mortgage
$123,250
Outstanding Balance
$58,839
Interest Rate
3.09%
Mortgage Type
Future Advance Clause Open End Mortgage
Estimated Equity
$68,156
Purchase Details
Closed on
May 17, 2016
Sold by
Henderson Jerry D and Jerry D Henderson Living Trust
Bought by
Equity Trust Co
Purchase Details
Closed on
Jan 7, 2002
Sold by
Lindo Patrick E and Lindo Lisa L
Bought by
Conseco Finance Servicing Corp and Green Tree Financial Servicing Corp
Purchase Details
Closed on
Sep 6, 2001
Sold by
Conseco Finance Servicing Corp
Bought by
Conseco Finance Servicing Corp and Green Tree Financial Servicing Corp
Create a Home Valuation Report for This Property
The Home Valuation Report is an in-depth analysis detailing your home's value as well as a comparison with similar homes in the area
Home Values in the Area
Average Home Value in this Area
Purchase History
| Date | Buyer | Sale Price | Title Company |
|---|---|---|---|
| Equity Trust Company | -- | None Available | |
| Equity Trust Co | $40,000 | None Available | |
| Conseco Finance Servicing Corp | -- | -- | |
| Conseco Finance Servicing Corp | -- | -- |
Source: Public Records
Mortgage History
| Date | Status | Borrower | Loan Amount |
|---|---|---|---|
| Open | Equity Trust Company | $123,250 |
Source: Public Records
Tax History Compared to Growth
Tax History
| Year | Tax Paid | Tax Assessment Tax Assessment Total Assessment is a certain percentage of the fair market value that is determined by local assessors to be the total taxable value of land and additions on the property. | Land | Improvement |
|---|---|---|---|---|
| 2024 | $1,031 | $9,358 | $1,868 | $7,490 |
| 2023 | $1,031 | $8,913 | $1,581 | $7,332 |
| 2022 | $934 | $8,489 | $1,256 | $7,233 |
| 2021 | $889 | $8,085 | $1,414 | $6,671 |
| 2020 | $854 | $7,700 | $1,529 | $6,171 |
| 2019 | $811 | $7,449 | $1,512 | $5,937 |
| 2018 | $726 | $7,095 | $0 | $0 |
| 2017 | $706 | $6,874 | $1,249 | $5,625 |
| 2016 | $651 | $6,269 | $1,197 | $5,072 |
| 2015 | $648 | $5,970 | $1,249 | $4,721 |
| 2014 | $621 | $5,715 | $1,108 | $4,607 |
Source: Public Records
Map
Nearby Homes
- 0 N 1209 Blvd
- 1208 Cathy Ln
- 1105 N Beach Ave
- 8517 Justin Place
- 8816 NE 17th St
- 3912 Parkwoods Ln
- 8319 NE 10th St
- 1113 S Locust Dr
- 4501 Meadowpark Dr
- 4212 Bonaparte Blvd
- 3701 Woodside Dr
- 2222 N Douglas Blvd
- 1033 Holly Ln
- 1912 N Saint Peter Ave
- 1521 McDonald Dr
- 1034 Jasmine Ln
- 1601 Mcgregor Dr
- 1617 Mcgregor Dr
- 1312 Hickory Ln
- 904 Cypress Cove
- 8906 NE 13th St
- 8902 NE 13th St
- 8908 NE 13th St
- 8900 NE 13th St
- 8903 NE 12th St
- 8907 NE 12th St
- 8910 NE 13th St
- 8820 NE 13th St
- 8901 NE 12th St
- 8909 NE 12th St
- 8911 NE 12th St
- 8821 NE 12th St
- 8912 NE 13th St
- 8818 NE 13th St
- 8909 NE 13th St
- 8913 NE 12th St
- 8819 NE 12th St
- 8914 NE 13th St
- 8816 NE 13th St
- 8900 NE 12th St