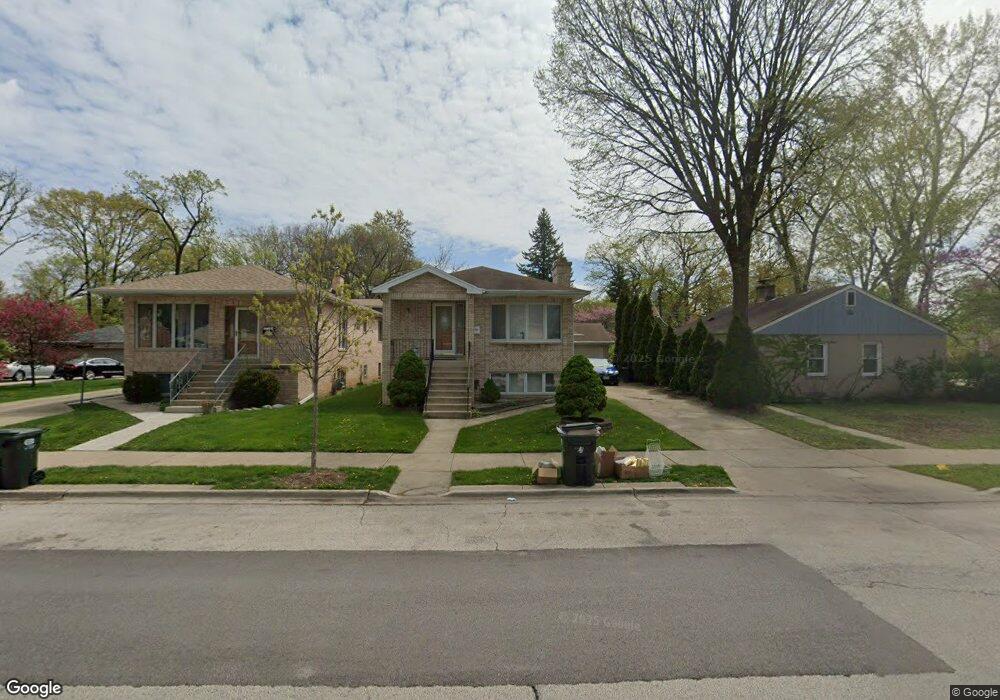
8905 Central Ave Morton Grove, IL 60053
Estimated Value: $436,000 - $532,699
4
Beds
3
Baths
1,356
Sq Ft
$344/Sq Ft
Est. Value
About This Home
This home is located at 8905 Central Ave, Morton Grove, IL 60053 and is currently estimated at $466,425, approximately $343 per square foot. 8905 Central Ave is a home located in Cook County with nearby schools including Park View Elementary School, Niles West High School, and Arie Crown Hebrew Day School.
Ownership History
Date
Name
Owned For
Owner Type
Purchase Details
Closed on
Jan 29, 2019
Sold by
Vo Mai D and Vo No V
Bought by
Vo No Van
Current Estimated Value
Home Financials for this Owner
Home Financials are based on the most recent Mortgage that was taken out on this home.
Original Mortgage
$234,000
Outstanding Balance
$213,542
Interest Rate
6.6%
Mortgage Type
Adjustable Rate Mortgage/ARM
Estimated Equity
$252,883
Purchase Details
Closed on
Dec 17, 2002
Sold by
Vo Mai D
Bought by
Vo Mai D and Vo No V
Purchase Details
Closed on
Sep 30, 1997
Sold by
Ryan James and Ryan Kathleen
Bought by
Minihane Michael J and Minihane Maurice Julie
Home Financials for this Owner
Home Financials are based on the most recent Mortgage that was taken out on this home.
Original Mortgage
$214,000
Interest Rate
7.54%
Mortgage Type
Balloon
Create a Home Valuation Report for This Property
The Home Valuation Report is an in-depth analysis detailing your home's value as well as a comparison with similar homes in the area
Home Values in the Area
Average Home Value in this Area
Purchase History
| Date | Buyer | Sale Price | Title Company |
|---|---|---|---|
| Vo No Van | -- | Attorney | |
| Vo Mai D | -- | -- | |
| Vo Mai D | -- | -- | |
| Minihane Michael J | $192,333 | Lawyers Title Insurance Corp |
Source: Public Records
Mortgage History
| Date | Status | Borrower | Loan Amount |
|---|---|---|---|
| Open | Vo No Van | $234,000 | |
| Closed | Minihane Michael J | $214,000 |
Source: Public Records
Tax History Compared to Growth
Tax History
| Year | Tax Paid | Tax Assessment Tax Assessment Total Assessment is a certain percentage of the fair market value that is determined by local assessors to be the total taxable value of land and additions on the property. | Land | Improvement |
|---|---|---|---|---|
| 2024 | $12,420 | $43,000 | $8,060 | $34,940 |
| 2023 | $11,834 | $43,000 | $8,060 | $34,940 |
| 2022 | $11,834 | $43,000 | $8,060 | $34,940 |
| 2021 | $6,348 | $25,787 | $4,960 | $20,827 |
| 2020 | $6,308 | $25,787 | $4,960 | $20,827 |
| 2019 | $8,113 | $28,975 | $4,960 | $24,015 |
| 2018 | $8,697 | $27,561 | $4,495 | $23,066 |
| 2017 | $4,938 | $27,561 | $4,495 | $23,066 |
| 2016 | $5,561 | $30,028 | $4,495 | $25,533 |
| 2015 | $6,282 | $24,048 | $3,875 | $20,173 |
| 2014 | $6,144 | $24,048 | $3,875 | $20,173 |
| 2013 | $6,146 | $24,048 | $3,875 | $20,173 |
Source: Public Records
Map
Nearby Homes
- 5536 Greenwood St
- 8918 Parkside Ave
- 5459 Suffield Ct
- 5352 Greenwood St
- 8841 Menard Ave
- 8708 Central Ave
- 5449 Arcadia St
- 5346 Suffield Terrace
- 8655 Harms Rd
- 8836 Mansfield Ave
- 5247 Suffield Ct
- 9234 Central Ave
- 5309 Crain St
- 9224 Menard Ave
- 8541 Lotus Ave Unit 914
- 5644 Lyons St
- 5128 Suffield Ct
- 5510 Lincoln Ave Unit B301
- 5510 Lincoln Ave Unit B101
- 5506 Lincoln Ave Unit A117
- 8907 Central Ave
- 8901 Central Ave
- 8901 Central Ave
- 5534 Greenwood St
- 8915 Central Ave
- 5530 Greenwood St
- 8845 Central Ave
- 8845 Central Ave
- 8921 Central Ave
- 8921 Central Ave
- 8908 Central Ave
- 8908 Central Ave
- 8902 Central Ave
- 8839 Central Ave
- 8914 Central Ave
- 5526 Greenwood St
- 5531 Greenwood St
- 5531 Greenwood St
- 8918 Central Ave
- 8925 Central Ave