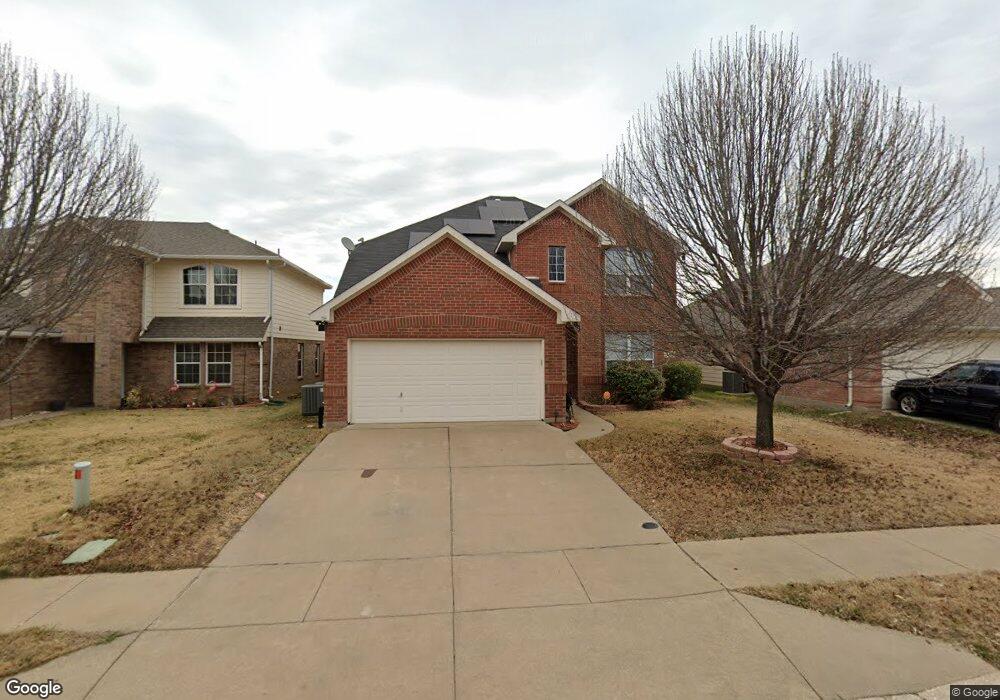
8905 Flying Ranch Rd Unit 1 Fort Worth, TX 76134
Willow Creek NeighborhoodEstimated Value: $314,000 - $348,000
4
Beds
3
Baths
2,622
Sq Ft
$125/Sq Ft
Est. Value
About This Home
This home is located at 8905 Flying Ranch Rd Unit 1, Fort Worth, TX 76134 and is currently estimated at $326,863, approximately $124 per square foot. 8905 Flying Ranch Rd Unit 1 is a home located in Tarrant County with nearby schools including Parkway Elementary School, H F Stevens Middle School, and Crowley High School.
Ownership History
Date
Name
Owned For
Owner Type
Purchase Details
Closed on
Nov 22, 2013
Sold by
Coleman Shrevondolyn S and Robinson Shrevondolyn S
Bought by
Coleman Shrevondolyn S
Current Estimated Value
Home Financials for this Owner
Home Financials are based on the most recent Mortgage that was taken out on this home.
Original Mortgage
$167,742
Outstanding Balance
$125,637
Interest Rate
4.34%
Mortgage Type
VA
Estimated Equity
$201,226
Purchase Details
Closed on
Nov 2, 2007
Sold by
Antares Homes Ltd
Bought by
Robinson Shrevondolyn S
Home Financials for this Owner
Home Financials are based on the most recent Mortgage that was taken out on this home.
Original Mortgage
$161,170
Interest Rate
6.43%
Mortgage Type
VA
Purchase Details
Closed on
Aug 22, 2006
Sold by
Matador Ranch Partners Ltd
Bought by
Antares Homes Ltd
Create a Home Valuation Report for This Property
The Home Valuation Report is an in-depth analysis detailing your home's value as well as a comparison with similar homes in the area
Home Values in the Area
Average Home Value in this Area
Purchase History
| Date | Buyer | Sale Price | Title Company |
|---|---|---|---|
| Coleman Shrevondolyn S | -- | Allegiance Title Company | |
| Robinson Shrevondolyn S | -- | None Available | |
| Antares Homes Ltd | -- | Alamo Title Company |
Source: Public Records
Mortgage History
| Date | Status | Borrower | Loan Amount |
|---|---|---|---|
| Open | Coleman Shrevondolyn S | $167,742 | |
| Closed | Robinson Shrevondolyn S | $161,170 | |
| Closed | Antares Homes Ltd | $0 |
Source: Public Records
Tax History Compared to Growth
Tax History
| Year | Tax Paid | Tax Assessment Tax Assessment Total Assessment is a certain percentage of the fair market value that is determined by local assessors to be the total taxable value of land and additions on the property. | Land | Improvement |
|---|---|---|---|---|
| 2025 | -- | $342,180 | $40,000 | $302,180 |
| 2024 | -- | $342,180 | $40,000 | $302,180 |
| 2023 | $7,326 | $352,339 | $40,000 | $312,339 |
| 2022 | $7,481 | $329,998 | $40,000 | $289,998 |
| 2021 | $7,155 | $250,775 | $40,000 | $210,775 |
| 2020 | $6,568 | $223,929 | $40,000 | $183,929 |
| 2019 | $7,095 | $267,989 | $40,000 | $227,989 |
| 2018 | $5,045 | $210,178 | $30,000 | $180,178 |
| 2017 | $6,018 | $202,587 | $30,000 | $172,587 |
| 2016 | $5,471 | $174,744 | $30,000 | $144,744 |
| 2015 | $4,208 | $168,600 | $25,000 | $143,600 |
| 2014 | $4,208 | $168,600 | $25,000 | $143,600 |
Source: Public Records
Map
Nearby Homes
- 2057 Matador Ranch Rd
- 7833 White Spruce Ln
- 7821 White Spruce Ln
- 7817 White Spruce Ln
- 2041 Matador Ranch Rd
- 2400 Texas Ash Way
- 2404 Texas Ash Way
- 2400 Dahlia Dr
- 2405 Texas Ash Way
- 2409 Texas Ash Way
- 9117 Blakely Dr
- 2408 Dahlia Dr
- 2412 Texas Ash Way
- 2413 Dahlia Dr
- 2413 Texas Ash Way
- 2416 Texas Ash Way
- 2417 Texas Ash Way
- 2420 Texas Ash Way
- 2424 Texas Ash Way
- 2425 Dahlia Dr
- 8905 Flying Ranch Rd
- 8909 Flying Ranch Rd
- 8901 Flying Ranch Rd
- 8821 Flying Ranch Rd
- 8913 Flying Ranch Rd
- 8904 Flying Ranch Rd
- 8908 Waggoner Ranch Rd
- 8904 Waggoner Ranch Rd
- 8817 Flying Ranch Rd
- 8916 Waggoner Ranch Rd
- 8912 Waggoner Ranch Rd
- 8900 Flying Ranch Rd
- 8908 Flying Ranch Rd
- 8813 Flying Ranch Rd
- 8812 Waggoner Ranch Rd
- 8820 Flying Ranch Rd
- 8912 Flying Ranch Rd
- 8812 Flying Ranch Rd
- 8816 Flying Ranch Rd
- 2105 Joyner Ranch Rd