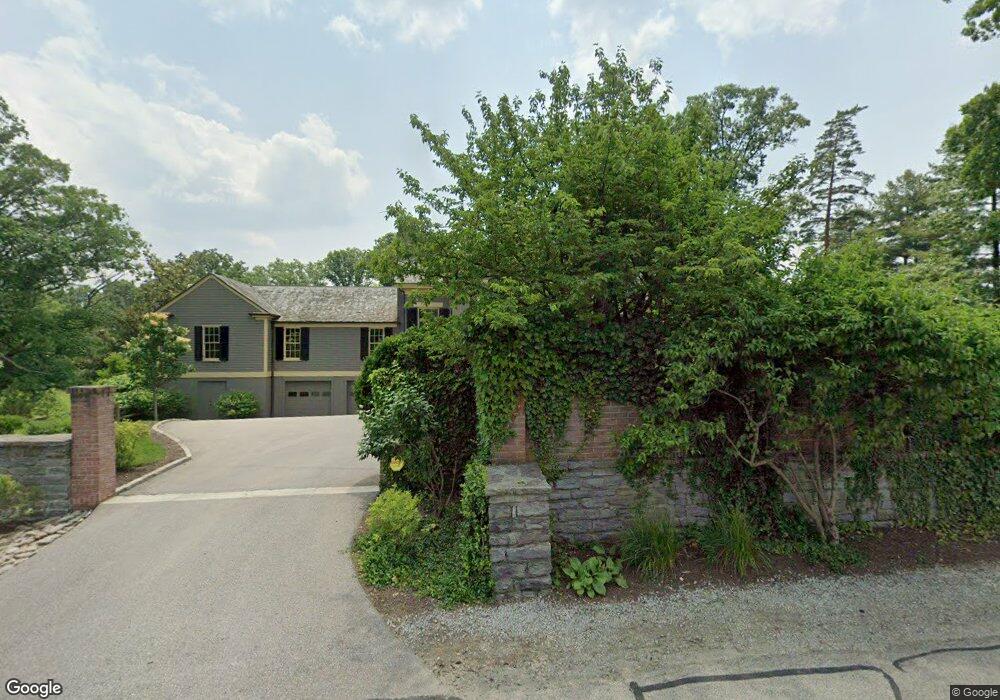
8905 Shawnee Run Rd Cincinnati, OH 45243
Estimated Value: $2,432,000 - $3,281,000
3
Beds
5
Baths
4,040
Sq Ft
$685/Sq Ft
Est. Value
About This Home
This home is located at 8905 Shawnee Run Rd, Cincinnati, OH 45243 and is currently estimated at $2,768,208, approximately $685 per square foot. 8905 Shawnee Run Rd is a home located in Hamilton County with nearby schools including Indian Hill Primary School, Indian Hill Elementary School, and Indian Hill Middle School.
Ownership History
Date
Name
Owned For
Owner Type
Purchase Details
Closed on
Mar 31, 2005
Sold by
Gh & R Business Services Inc
Bought by
Steinman Steven C and Steinman Sarah O
Current Estimated Value
Home Financials for this Owner
Home Financials are based on the most recent Mortgage that was taken out on this home.
Original Mortgage
$1,100,000
Outstanding Balance
$538,658
Interest Rate
5%
Mortgage Type
Fannie Mae Freddie Mac
Estimated Equity
$2,229,550
Purchase Details
Closed on
Mar 18, 2005
Sold by
Sawyer Ruth Dennis and Sawyer John
Bought by
Uhl Jay J
Home Financials for this Owner
Home Financials are based on the most recent Mortgage that was taken out on this home.
Original Mortgage
$1,100,000
Outstanding Balance
$538,658
Interest Rate
5%
Mortgage Type
Fannie Mae Freddie Mac
Estimated Equity
$2,229,550
Create a Home Valuation Report for This Property
The Home Valuation Report is an in-depth analysis detailing your home's value as well as a comparison with similar homes in the area
Home Values in the Area
Average Home Value in this Area
Purchase History
| Date | Buyer | Sale Price | Title Company |
|---|---|---|---|
| Steinman Steven C | -- | None Available | |
| Gh & R Business Services Inc | $1,875,000 | None Available | |
| Uhl Jay J | -- | None Available |
Source: Public Records
Mortgage History
| Date | Status | Borrower | Loan Amount |
|---|---|---|---|
| Open | Steinman Steven C | $1,100,000 |
Source: Public Records
Tax History Compared to Growth
Tax History
| Year | Tax Paid | Tax Assessment Tax Assessment Total Assessment is a certain percentage of the fair market value that is determined by local assessors to be the total taxable value of land and additions on the property. | Land | Improvement |
|---|---|---|---|---|
| 2024 | $27,372 | $764,953 | $236,068 | $528,885 |
| 2023 | $27,408 | $764,953 | $236,068 | $528,885 |
| 2022 | $27,030 | $621,146 | $177,055 | $444,091 |
| 2021 | $26,405 | $621,146 | $177,055 | $444,091 |
| 2020 | $23,083 | $621,146 | $177,055 | $444,091 |
| 2019 | $23,678 | $398,220 | $170,244 | $227,976 |
| 2018 | $15,858 | $398,220 | $170,244 | $227,976 |
| 2017 | $15,113 | $398,220 | $170,244 | $227,976 |
| 2016 | $15,472 | $405,497 | $177,776 | $227,721 |
| 2015 | $15,508 | $405,497 | $177,776 | $227,721 |
| 2014 | $15,389 | $405,497 | $177,776 | $227,721 |
| 2013 | $16,125 | $409,591 | $179,571 | $230,020 |
Source: Public Records
Map
Nearby Homes
- 6225 Redbird Hollow Ln
- 6220 Hawk Ridge Ln
- 8815 Old Indian Hill Rd
- 5995 Drake Rd
- 8180 Shawnee Run Rd
- 8240 Camargo Rd
- 6680 N Clippinger Dr
- 8205 Indian Trail Dr
- 7855 Loveland Madeira Rd
- 7201 Longfield Dr
- 312 Rugby Ave
- 3 Noel Ln
- 8012 Euclid Ave
- 8140 Maxfield Ln
- 9675 Cunningham Rd
- 7252 Osceola Dr
- 7241 Osceola Dr
- 214 Rugby Ave
- 7316 Osceola Dr
- 7247 Iuka Ave
- 6600 Given Rd
- 9005 Shawnee Run Rd
- 6525 Given Rd
- 9020 Shawnee Run Rd
- 6500 Given Rd
- 9100 Shawnee Run Rd Unit 5
- 9060 Shawnee Run Rd
- 6475 Given Rd
- 6450 Given Rd
- 6900 Given Rd
- 8700 Shawnee Run Rd
- 8680 Shawnee Run Rd
- 6908 Given Rd
- 9055 Shawnee Run Rd
- 8640 Shawnee Run Rd
- 6405 Given Rd
- 6910 Given Rd
- 6400 Given Rd
- 1 Abbey Place
- 1 Abbey Place