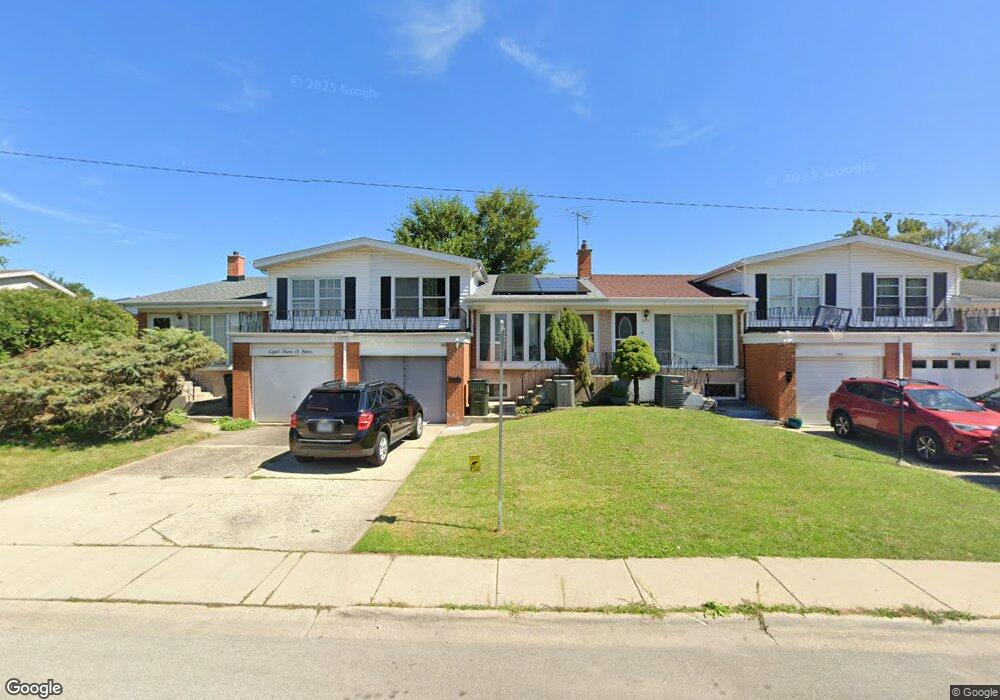
8907 Robin Dr Des Plaines, IL 60016
Estimated Value: $280,000 - $309,000
3
Beds
2
Baths
1,403
Sq Ft
$208/Sq Ft
Est. Value
About This Home
This home is located at 8907 Robin Dr, Des Plaines, IL 60016 and is currently estimated at $292,035, approximately $208 per square foot. 8907 Robin Dr is a home located in Cook County with nearby schools including Apollo Elementary School, Gemini Middle School, and Maine East High School.
Ownership History
Date
Name
Owned For
Owner Type
Purchase Details
Closed on
Jun 23, 2021
Sold by
Sivanathan Ratnavel and Sivanathan Veena
Bought by
Fernandez Jose U and Fernandez Ricardo U
Current Estimated Value
Home Financials for this Owner
Home Financials are based on the most recent Mortgage that was taken out on this home.
Original Mortgage
$235,653
Interest Rate
2.75%
Mortgage Type
FHA
Purchase Details
Closed on
Aug 27, 2012
Sold by
Selene Rmof Reo Acqusition Llc
Bought by
Sivanathan Veena Kumari
Purchase Details
Closed on
Feb 21, 2007
Sold by
Declaration Mcmanemin Marita
Bought by
Ratnavel Sivanathan and Sivanathan Veena
Home Financials for this Owner
Home Financials are based on the most recent Mortgage that was taken out on this home.
Original Mortgage
$192,000
Interest Rate
6.28%
Mortgage Type
Unknown
Purchase Details
Closed on
Jun 9, 2006
Sold by
Mcmanemin Marita
Bought by
Mcmanemin Marita and Marita Mcmanemin Declaration Of Trust
Create a Home Valuation Report for This Property
The Home Valuation Report is an in-depth analysis detailing your home's value as well as a comparison with similar homes in the area
Home Values in the Area
Average Home Value in this Area
Purchase History
| Date | Buyer | Sale Price | Title Company |
|---|---|---|---|
| Fernandez Jose U | $240,000 | Chicago Title | |
| Sivanathan Veena Kumari | $65,000 | Wheatland Title Guaranty | |
| Ratnavel Sivanathan | $240,000 | Attorneys Title Guaranty Fun | |
| Mcmanemin Marita | -- | None Available |
Source: Public Records
Mortgage History
| Date | Status | Borrower | Loan Amount |
|---|---|---|---|
| Previous Owner | Fernandez Jose U | $235,653 | |
| Previous Owner | Ratnavel Sivanathan | $192,000 |
Source: Public Records
Tax History Compared to Growth
Tax History
| Year | Tax Paid | Tax Assessment Tax Assessment Total Assessment is a certain percentage of the fair market value that is determined by local assessors to be the total taxable value of land and additions on the property. | Land | Improvement |
|---|---|---|---|---|
| 2024 | $6,233 | $23,000 | $3,500 | $19,500 |
| 2023 | $5,928 | $23,000 | $3,500 | $19,500 |
| 2022 | $5,928 | $23,000 | $3,500 | $19,500 |
| 2021 | $3,831 | $15,530 | $2,105 | $13,425 |
| 2020 | $3,812 | $15,530 | $2,105 | $13,425 |
| 2019 | $3,731 | $17,256 | $2,105 | $15,151 |
| 2018 | $4,049 | $16,603 | $1,841 | $14,762 |
| 2017 | $4,011 | $16,603 | $1,841 | $14,762 |
| 2016 | $3,992 | $16,603 | $1,841 | $14,762 |
| 2015 | $3,970 | $15,466 | $1,578 | $13,888 |
| 2014 | $3,847 | $15,466 | $1,578 | $13,888 |
| 2013 | $3,469 | $14,216 | $1,578 | $12,638 |
Source: Public Records
Map
Nearby Homes
- 8999 Kennedy Dr Unit 1B
- 8807 Dee Rd
- 8810 Briar Ct Unit 1B
- 8808 Briar Ct Unit 88082A
- 9332 Landings Ln Unit 504
- 9356 Landings Ln Unit 505
- 9355 Landings Ln Unit 406
- 1710 Dempster St Unit C
- 9375 Landings Ln Unit 407
- 9396 Landings Ln Unit 203
- 9396 Landings Ln Unit 301
- 9396 Landings Ln Unit 506
- 9396 Landings Ln Unit 207
- 9396 Landings Ln Unit 404
- 9396 Landings Ln Unit 605
- 9231 Aspen Ln
- 9153 W Oaks Ave
- 8974 N Western Ave Unit D409
- 1500 Davis St
- 9209 Potter Rd Unit 2F
- 8907 Robin Dr
- 8905 Robin Dr
- 8909 Robin Dr
- 8903 Robin Dr
- 8917 Robin Dr
- 8919 Robin Dr
- 8908 Robin Dr
- 8906 Robin Dr
- 8921 Robin Dr
- 8904 Robin Dr
- 8916 Robin Dr
- 8911 Robin Dr
- 8911 Robin Dr
- 8911 Robin Dr
- 8911 Robin Dr
- 8911 Robin Dr
- 8911 Robin Dr
- 8911 Robin Dr Unit A
- 8911 Robin Dr Unit D
- 8911 Robin Dr Unit B