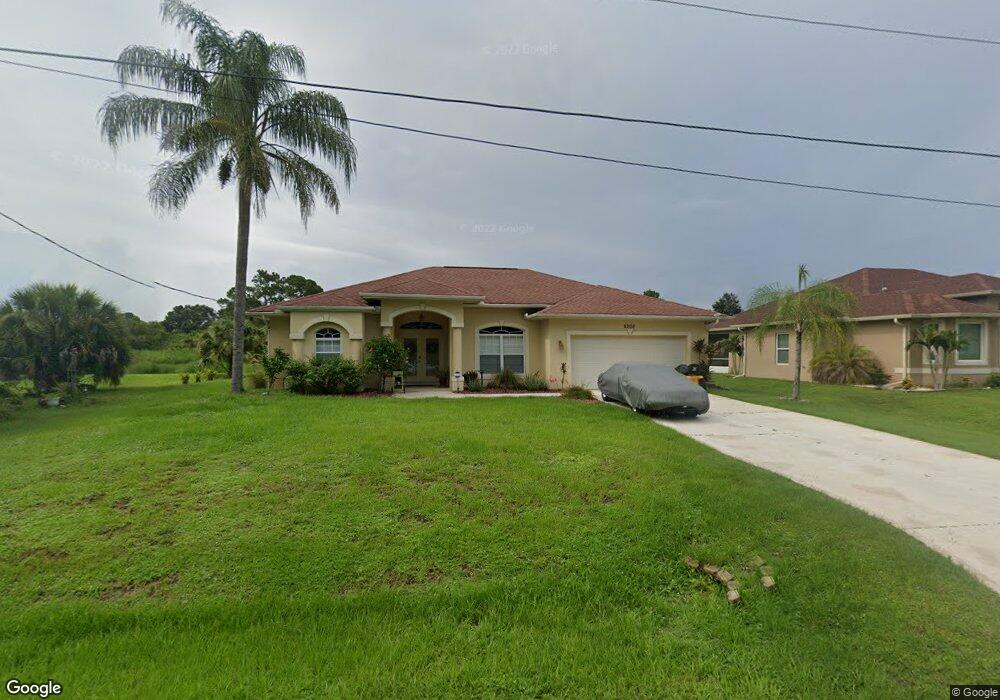
8908 Leopold Ave North Port, FL 34287
Estimated Value: $298,000 - $365,000
3
Beds
2
Baths
1,755
Sq Ft
$187/Sq Ft
Est. Value
About This Home
This home is located at 8908 Leopold Ave, North Port, FL 34287 and is currently estimated at $327,629, approximately $186 per square foot. 8908 Leopold Ave is a home located in Sarasota County with nearby schools including Glenallen Elementary School, North Port High School, and Heron Creek Middle School.
Ownership History
Date
Name
Owned For
Owner Type
Purchase Details
Closed on
Jul 1, 2008
Sold by
Washington Mutual Bank
Bought by
Bartlett David and Bartlett Debra
Current Estimated Value
Home Financials for this Owner
Home Financials are based on the most recent Mortgage that was taken out on this home.
Original Mortgage
$107,900
Interest Rate
6.61%
Mortgage Type
Purchase Money Mortgage
Purchase Details
Closed on
Apr 29, 2008
Sold by
Brudner Svetlana and Mortgage Electronic Registrati
Bought by
Washington Mutual Bank
Purchase Details
Closed on
Sep 16, 2005
Sold by
Windemere Homes Inc
Bought by
Brudner Svetlana
Home Financials for this Owner
Home Financials are based on the most recent Mortgage that was taken out on this home.
Original Mortgage
$190,959
Interest Rate
5.77%
Mortgage Type
Fannie Mae Freddie Mac
Purchase Details
Closed on
Oct 25, 2002
Sold by
Gelner Victor V and Gelner Mavis E
Bought by
Berman Herbert L and Berman Jeffrey S
Create a Home Valuation Report for This Property
The Home Valuation Report is an in-depth analysis detailing your home's value as well as a comparison with similar homes in the area
Home Values in the Area
Average Home Value in this Area
Purchase History
| Date | Buyer | Sale Price | Title Company |
|---|---|---|---|
| Bartlett David | $134,900 | Attorney | |
| Washington Mutual Bank | -- | None Available | |
| Brudner Svetlana | $238,700 | Chelsea Title Company | |
| Berman Herbert L | $1,000 | -- |
Source: Public Records
Mortgage History
| Date | Status | Borrower | Loan Amount |
|---|---|---|---|
| Previous Owner | Bartlett David | $107,900 | |
| Previous Owner | Brudner Svetlana | $190,959 |
Source: Public Records
Tax History Compared to Growth
Tax History
| Year | Tax Paid | Tax Assessment Tax Assessment Total Assessment is a certain percentage of the fair market value that is determined by local assessors to be the total taxable value of land and additions on the property. | Land | Improvement |
|---|---|---|---|---|
| 2024 | $4,238 | $246,400 | $23,500 | $222,900 |
| 2023 | $4,238 | $245,000 | $19,500 | $225,500 |
| 2022 | $4,240 | $257,000 | $19,800 | $237,200 |
| 2021 | $3,768 | $195,700 | $9,300 | $186,400 |
| 2020 | $3,522 | $178,700 | $8,500 | $170,200 |
| 2019 | $3,497 | $185,000 | $8,900 | $176,100 |
| 2018 | $3,075 | $165,600 | $8,400 | $157,200 |
| 2017 | $2,932 | $141,886 | $0 | $0 |
| 2016 | $2,776 | $146,900 | $4,900 | $142,000 |
| 2015 | $2,503 | $117,800 | $4,500 | $113,300 |
| 2014 | $2,401 | $96,910 | $0 | $0 |
Source: Public Records
Map
Nearby Homes
- 0 Dolomite Ave Unit MFRA4615784
- 0 Norbert Ave Unit MFRA4630785
- LOT 10 Octavius Ave
- 8444 Octavius Ave
- 1372 S Hartsdale St
- 0 Lancelot Ave Unit MFRC7475995
- Lot 8 Lipscomb St
- 8849 Attalla Ave
- 0972169150 Raoul Ave
- Lot 15 Attalla Ave
- LOT 12 Attalla Ave
- 8315 Raoul Ave
- LOT 28 Florala St
- 0 Waltrip St
- 1803 Amato St
- LOT 17 Karluk St
- 0 Karluk St Unit 315085
- 0 N Biscayne Dr Unit A4560392
- 1554 Karluk St
- 0 Selover Rd Unit MFRC7513382
- 8878 Leopold Ave
- 8848 Leopold Ave
- 8877 Leopold Ave
- 8439 Malcolm Ave
- 8847 Leopold Ave
- 8449 Malcolm Ave
- 8984 Leopold Ave
- 8817 Leopold Ave
- 8906 Dolomite Ave
- 0 Florala St Unit D6101826
- 0 Florala St Unit C690274
- 0 Florala St Unit C695901
- 0 Florala St Unit MFRA4599212
- 0 Florala St Unit MFRA4580813
- 0 Florala St Unit MFRC7474549
- 0 Florala St Unit S5071558
- 0 Florala St Unit C7453001
- 0 Florala St Unit A4486916
- 0 Florala St Unit A4466073
- 0 Florala St Unit A4441735