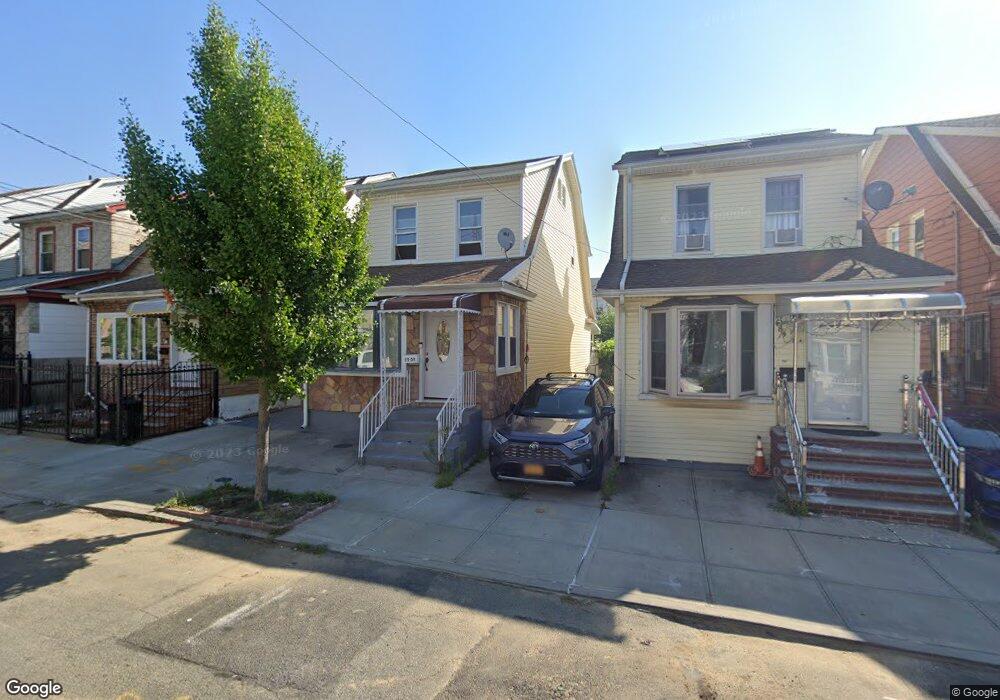
8909 182nd Place Hollis, NY 11423
Jamaica NeighborhoodEstimated Value: $819,000 - $911,000
--
Bed
--
Bath
1,656
Sq Ft
$524/Sq Ft
Est. Value
About This Home
This home is located at 8909 182nd Place, Hollis, NY 11423 and is currently estimated at $868,312, approximately $524 per square foot. 8909 182nd Place is a home located in Queens County with nearby schools including P.S. 95 - Eastwood, I.S. 238 Susan B Anthony Academy, and Immaculate Conception Catholic Academy.
Ownership History
Date
Name
Owned For
Owner Type
Purchase Details
Closed on
Oct 18, 2024
Sold by
Ahmed Main U
Bought by
Ahmed Main U and Akhter Afia
Current Estimated Value
Purchase Details
Closed on
Jun 23, 2022
Sold by
Prittipal Sabreena and Prittipal Sanjay
Bought by
Ahmed Main U
Purchase Details
Closed on
Jul 2, 2004
Sold by
Prittipal Sanjay
Bought by
Prittipal Sabreena and Prittipal Sanjay
Purchase Details
Closed on
Nov 17, 2003
Sold by
Dor Bernadette and Dor Marc
Bought by
Prittipal Sanjay
Home Financials for this Owner
Home Financials are based on the most recent Mortgage that was taken out on this home.
Original Mortgage
$294,500
Interest Rate
5.6%
Mortgage Type
Purchase Money Mortgage
Purchase Details
Closed on
May 31, 1995
Sold by
Rodriguez Ulysses and Rodriguez Ramona
Bought by
Dor Marc and Dor Bernadette
Home Financials for this Owner
Home Financials are based on the most recent Mortgage that was taken out on this home.
Original Mortgage
$155,750
Interest Rate
8.21%
Mortgage Type
FHA
Create a Home Valuation Report for This Property
The Home Valuation Report is an in-depth analysis detailing your home's value as well as a comparison with similar homes in the area
Home Values in the Area
Average Home Value in this Area
Purchase History
| Date | Buyer | Sale Price | Title Company |
|---|---|---|---|
| Ahmed Main U | -- | -- | |
| Ahmed Main U | $820,000 | -- | |
| Ahmed Main U | $820,000 | -- | |
| Prittipal Sabreena | -- | -- | |
| Prittipal Sabreena | -- | -- | |
| Prittipal Sanjay | $310,000 | -- | |
| Prittipal Sanjay | $310,000 | -- | |
| Dor Marc | $165,000 | First American Title Ins Co | |
| Dor Marc | $165,000 | First American Title Ins Co |
Source: Public Records
Mortgage History
| Date | Status | Borrower | Loan Amount |
|---|---|---|---|
| Previous Owner | Prittipal Sanjay | $294,500 | |
| Previous Owner | Dor Marc | $155,750 |
Source: Public Records
Tax History Compared to Growth
Tax History
| Year | Tax Paid | Tax Assessment Tax Assessment Total Assessment is a certain percentage of the fair market value that is determined by local assessors to be the total taxable value of land and additions on the property. | Land | Improvement |
|---|---|---|---|---|
| 2025 | $6,557 | $34,603 | $9,287 | $25,316 |
| 2024 | $6,557 | $32,645 | $9,421 | $23,224 |
| 2023 | $6,457 | $31,795 | $9,269 | $22,526 |
| 2022 | $5,888 | $42,120 | $13,800 | $28,320 |
| 2021 | $6,136 | $43,260 | $13,800 | $29,460 |
| 2020 | $5,808 | $37,200 | $13,800 | $23,400 |
| 2019 | $5,398 | $33,660 | $13,800 | $19,860 |
| 2018 | $5,104 | $26,496 | $12,336 | $14,160 |
| 2017 | $4,955 | $25,776 | $13,443 | $12,333 |
| 2016 | $4,782 | $25,776 | $13,443 | $12,333 |
| 2015 | $2,713 | $24,030 | $13,178 | $10,852 |
| 2014 | $2,713 | $22,670 | $13,138 | $9,532 |
Source: Public Records
Map
Nearby Homes
- 8918 182nd Place
- 8908 182nd St
- 8830 182nd St Unit 1E
- 88-30 182nd St Unit 1H
- 88-30 182nd St Unit 4D
- 8830 182nd St Unit 3F
- 182-34 Hillside Ave
- 182-36 Hillside Ave
- 8931 184th St
- 8829 184th St
- 182-04 91st Ave
- 9037 180th St
- 91-19 182nd St
- 91-28 182nd Place
- 180-16 Wexford Terrace Unit 5D
- 88-22 186th St
- 90-11 179th St
- 182-25 Wexford Terrace Unit 506
- 90-21 185th St
- 90-19 185th St
- 8911 182nd Place
- 8907 182nd Place
- 8915 182nd Place
- 8905 182nd Place
- 182-28 89th Ave
- 18228 89th Ave
- 8917 182nd Place
- 8917 182nd Place Unit 1
- 8917 182nd Place
- 89-09 182nd Place
- 8919 182nd Place
- 8910 183rd St
- 89-12 183rd St
- 8908 183rd St
- 8912 183rd St
- 8904 183rd St
- 8914 183rd St
- 8921 182nd Place
- 18242 89th Ave
- 8916 183rd St