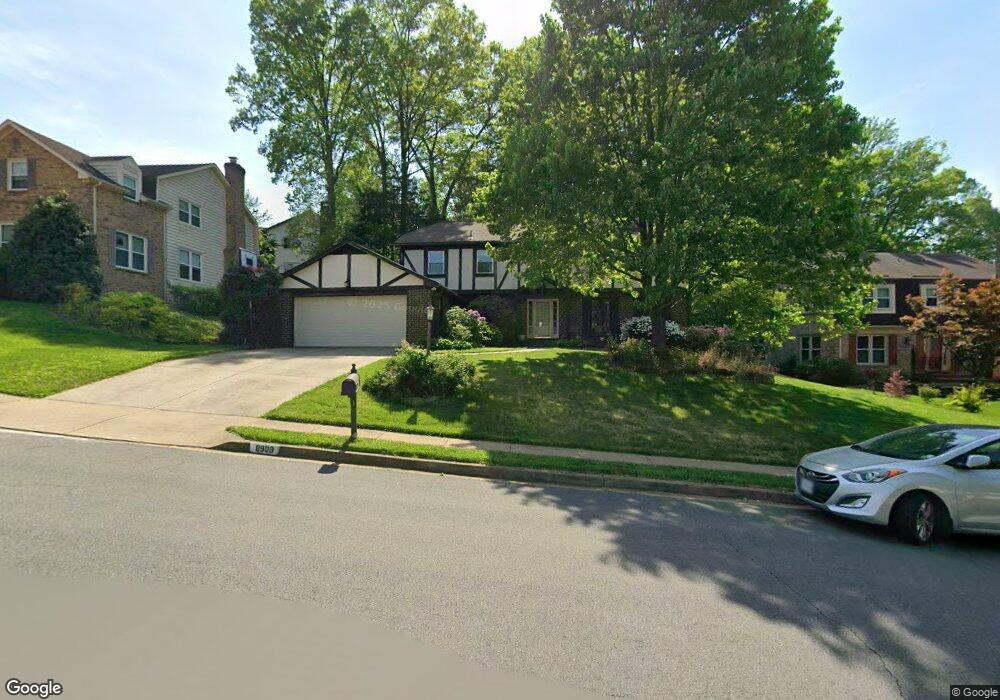
8909 Glade Hill Rd Fairfax, VA 22031
Estimated Value: $1,140,000 - $1,227,000
4
Beds
4
Baths
2,816
Sq Ft
$417/Sq Ft
Est. Value
About This Home
This home is located at 8909 Glade Hill Rd, Fairfax, VA 22031 and is currently estimated at $1,173,637, approximately $416 per square foot. 8909 Glade Hill Rd is a home located in Fairfax County with nearby schools including Mantua Elementary School, Frost Middle School, and W. T. Woodson High School.
Ownership History
Date
Name
Owned For
Owner Type
Purchase Details
Closed on
Aug 7, 2020
Sold by
Dengler Steven and Dengler Cynthia
Bought by
Blumenthal Philip E and Blumenthal Rachel L
Current Estimated Value
Home Financials for this Owner
Home Financials are based on the most recent Mortgage that was taken out on this home.
Original Mortgage
$760,500
Outstanding Balance
$674,617
Interest Rate
3%
Mortgage Type
New Conventional
Estimated Equity
$499,020
Purchase Details
Closed on
Jan 21, 1999
Sold by
Slovikosky Ilene M
Bought by
Dengler Steve
Home Financials for this Owner
Home Financials are based on the most recent Mortgage that was taken out on this home.
Original Mortgage
$279,900
Interest Rate
6.7%
Purchase Details
Closed on
Jun 15, 1994
Sold by
Ghanem George
Bought by
Kasloff Ilene M
Home Financials for this Owner
Home Financials are based on the most recent Mortgage that was taken out on this home.
Original Mortgage
$200,000
Interest Rate
8.5%
Create a Home Valuation Report for This Property
The Home Valuation Report is an in-depth analysis detailing your home's value as well as a comparison with similar homes in the area
Home Values in the Area
Average Home Value in this Area
Purchase History
| Date | Buyer | Sale Price | Title Company |
|---|---|---|---|
| Blumenthal Philip E | $845,000 | Commonwealth Land Ttl Ins Co | |
| Dengler Steve | $349,900 | -- | |
| Kasloff Ilene M | $331,000 | -- |
Source: Public Records
Mortgage History
| Date | Status | Borrower | Loan Amount |
|---|---|---|---|
| Open | Blumenthal Philip E | $760,500 | |
| Previous Owner | Dengler Steve | $279,900 | |
| Previous Owner | Kasloff Ilene M | $200,000 |
Source: Public Records
Tax History Compared to Growth
Tax History
| Year | Tax Paid | Tax Assessment Tax Assessment Total Assessment is a certain percentage of the fair market value that is determined by local assessors to be the total taxable value of land and additions on the property. | Land | Improvement |
|---|---|---|---|---|
| 2025 | $11,755 | $1,106,320 | $465,000 | $641,320 |
| 2024 | $11,755 | $1,014,690 | $425,000 | $589,690 |
| 2023 | $10,642 | $942,980 | $410,000 | $532,980 |
| 2022 | $10,140 | $886,730 | $380,000 | $506,730 |
| 2021 | $9,771 | $832,600 | $350,000 | $482,600 |
| 2020 | $9,457 | $799,040 | $335,000 | $464,040 |
| 2019 | $9,421 | $796,040 | $332,000 | $464,040 |
| 2018 | $8,737 | $759,770 | $322,000 | $437,770 |
| 2017 | $8,449 | $727,770 | $290,000 | $437,770 |
| 2016 | $8,431 | $727,770 | $290,000 | $437,770 |
| 2015 | $8,122 | $727,770 | $290,000 | $437,770 |
| 2014 | $7,262 | $652,220 | $263,000 | $389,220 |
Source: Public Records
Map
Nearby Homes
- 8907 Glade Hill Rd
- 9005 Southwick St
- 8920 Walker St
- 8803 Lynnhurst Dr
- 8908 Lynnhurst Dr
- 9207 Hunting Pines Place
- 3503 Alba Place
- 3769 Persimmon Cir
- 9017 Ellenwood Ln
- 3814 Persimmon Cir
- 3704 Persimmon Cir
- 3680 Persimmon Cir
- 8502 Woodbine Ln
- 4216 Elizabeth Ln
- 9350 Tovito Dr
- 4302 Wakefield Dr
- 9110 Glenbrook Rd
- 9368 Tovito Dr
- 4353 Starr Jordan Dr
- 4314 Selkirk Dr
- 8911 Glade Hill Rd
- 8908 Autumn Leaf Ct
- 8908 Glade Hill Rd
- 8906 Glade Hill Rd
- 8913 Glade Hill Rd
- 8905 Glade Hill Rd
- 8910 Glade Hill Rd
- 8906 Autumn Leaf Ct
- 8910 Autumn Leaf Ct
- 3712 Millbank Ct
- 8903 Glade Hill Rd
- 3713 Millbank Ct
- 3805 Moss Brooke Ct
- 8904 Autumn Leaf Ct
- 3803 Moss Brooke Ct
- 3807 Moss Brooke Ct
- 3711 MILL Millbank Ct
- 8917 Glade Hill Rd
- 3710 Millbank Ct
- 3800 Ridgelea Dr