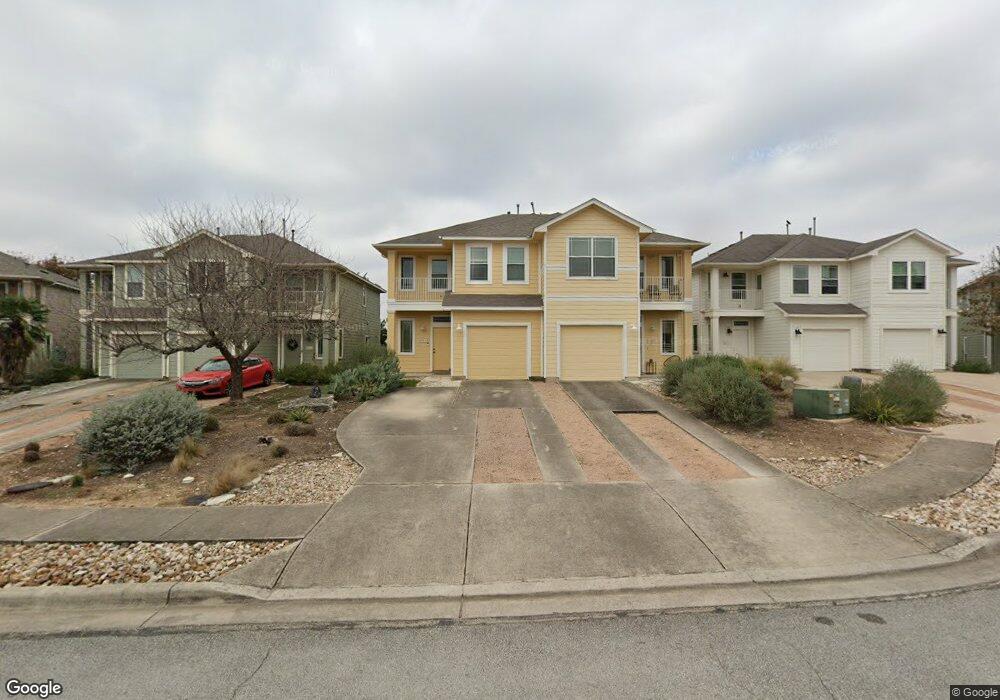
8909 Mountain Shadows Cove Unit 8909B Austin, TX 78735
West Oak Hill NeighborhoodEstimated Value: $340,881 - $604,000
--
Bed
5
Baths
1,404
Sq Ft
$321/Sq Ft
Est. Value
About This Home
This home is located at 8909 Mountain Shadows Cove Unit 8909B, Austin, TX 78735 and is currently estimated at $450,220, approximately $320 per square foot. 8909 Mountain Shadows Cove Unit 8909B is a home located in Travis County with nearby schools including Oak Hill Elementary School, Small Middle School, and Austin High School.
Ownership History
Date
Name
Owned For
Owner Type
Purchase Details
Closed on
Aug 6, 2021
Sold by
Vornhagen Sean C and Winscott Abby
Bought by
Trayser Amy Kayla
Current Estimated Value
Home Financials for this Owner
Home Financials are based on the most recent Mortgage that was taken out on this home.
Original Mortgage
$356,250
Outstanding Balance
$324,425
Interest Rate
3%
Mortgage Type
New Conventional
Estimated Equity
$125,795
Purchase Details
Closed on
Mar 5, 2015
Sold by
Campbell Lynn M
Bought by
Vornhagen Sean C
Home Financials for this Owner
Home Financials are based on the most recent Mortgage that was taken out on this home.
Original Mortgage
$204,300
Interest Rate
3.66%
Mortgage Type
New Conventional
Purchase Details
Closed on
Aug 12, 2004
Sold by
Mountain Shadows Building Partners Lp
Bought by
King Lamont and King Tamu C
Home Financials for this Owner
Home Financials are based on the most recent Mortgage that was taken out on this home.
Original Mortgage
$102,300
Interest Rate
6.87%
Mortgage Type
Purchase Money Mortgage
Create a Home Valuation Report for This Property
The Home Valuation Report is an in-depth analysis detailing your home's value as well as a comparison with similar homes in the area
Home Values in the Area
Average Home Value in this Area
Purchase History
| Date | Buyer | Sale Price | Title Company |
|---|---|---|---|
| Trayser Amy Kayla | -- | Independence Title | |
| Vornhagen Sean C | -- | Austin Title Co | |
| King Lamont | -- | -- |
Source: Public Records
Mortgage History
| Date | Status | Borrower | Loan Amount |
|---|---|---|---|
| Open | Trayser Amy Kayla | $356,250 | |
| Previous Owner | Vornhagen Sean C | $204,300 | |
| Previous Owner | King Lamont | $102,300 | |
| Closed | King Lamont | $12,750 |
Source: Public Records
Tax History Compared to Growth
Tax History
| Year | Tax Paid | Tax Assessment Tax Assessment Total Assessment is a certain percentage of the fair market value that is determined by local assessors to be the total taxable value of land and additions on the property. | Land | Improvement |
|---|---|---|---|---|
| 2025 | $5,190 | $328,187 | $40,170 | $288,017 |
| 2023 | $5,190 | $372,244 | $40,170 | $332,074 |
| 2022 | $9,069 | $459,210 | $40,170 | $419,040 |
| 2021 | $5,738 | $263,610 | $40,170 | $246,644 |
| 2020 | $5,140 | $239,645 | $40,170 | $238,251 |
| 2018 | $4,385 | $198,054 | $40,170 | $157,884 |
| 2017 | $5,131 | $230,067 | $40,170 | $189,897 |
| 2016 | $5,230 | $234,535 | $40,170 | $194,365 |
| 2015 | $4,442 | $216,772 | $40,170 | $176,602 |
| 2014 | $4,442 | $204,564 | $0 | $0 |
Source: Public Records
Map
Nearby Homes
- 6701 Covered Bridge Dr Unit 51
- 6701 Covered Bridge Dr
- 6906 Covered Bridge Dr
- 8818 Moccasin Path
- 6718 Silvermine Dr Unit 201
- 6718 Silvermine Dr Unit 804
- 5717 Medicine Creek Dr
- 6901 Bright Star Ln
- 8737 W Highway 71
- 6803 Silvermine Dr
- 7204 Covered Bridge Dr
- 5202 Pink Poppy Pass
- 7924 Yellow Thistle Unit 39
- 7921 Floracita Ln Unit 26
- 7925 Tusman Dr
- 7809 Old Bee Caves Rd Unit 15
- 7809 Old Bee Caves Rd Unit 14
- 7809 Old Bee Caves Rd Unit 13
- The Fresno Plan at Cayena Creekside
- The Yucatan Plan at Cayena Creekside
- 8909 Mountain Shadows Cove
- 8909 Mountain Shadows Cove Unit A
- 8909 Mountain Shadows Cove Unit B
- 8909 Mountain Shadows Cove Unit 8909B
- 8909 Mountain Shadows Cove Unit 8909A
- 8909 Mountain Shadows Cove Unit 8909A
- 8909 Mountain Shadows Cove
- 8909 A Mountain Shadows Cove
- 8905 Mountain Shadows Cove Unit A
- 8905 Mountain Shadows Cove Unit B
- 8905 Mountain Shadows Cove Unit 8905A
- 8905 Mountain Shadows Cove Unit 8905B
- 8905 Mountain Shadows Cove
- 8913 Mountain Shadows Cove Unit B
- 8913 Mountain Shadows Cove Unit A
- 8913 Mountain Shadows Cove Unit 8913A
- 8913 Mountain Shadows Cove Unit 8913B
- 8913 Mountain Shadows Cove Unit 8913A
- 8901 Mountain Shadows Cove Unit 8901A
- 8901 Mountain Shadows Cove Unit B