Estimated Value: $440,000 - $493,000
4
Beds
2
Baths
1,843
Sq Ft
$256/Sq Ft
Est. Value
About This Home
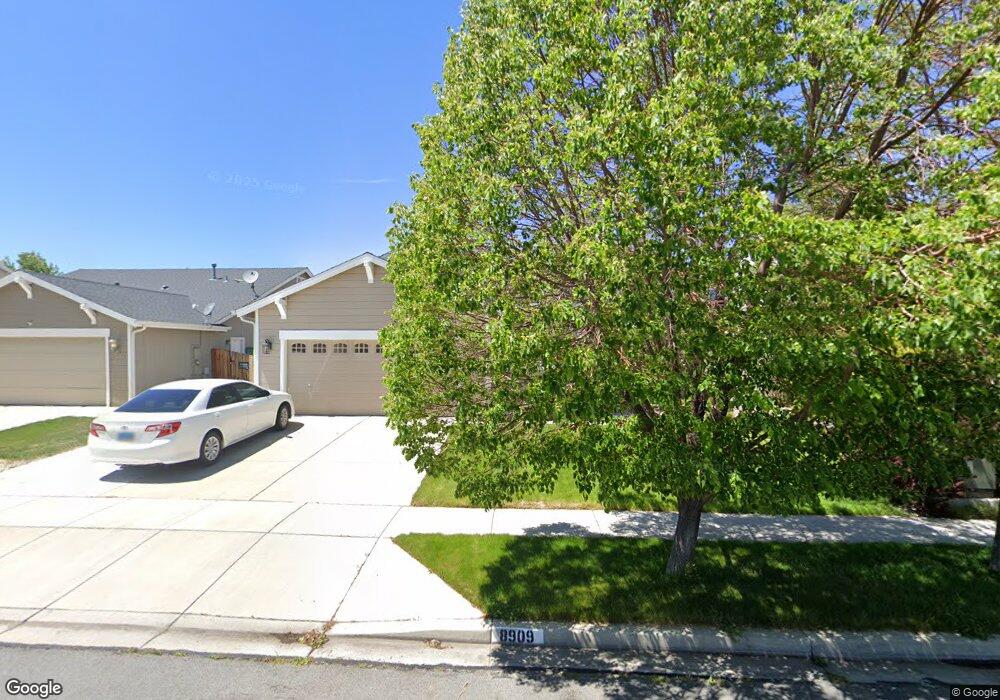
This home is located at 8909 Sorcha St, Reno, NV 89506 and is currently estimated at $472,682, approximately $256 per square foot. 8909 Sorcha St is a home located in Washoe County with nearby schools including Lemmon Valley Elementary School, William O'Brien Middle School, and North Valleys High School.
Ownership History
Date
Name
Owned For
Owner Type
Purchase Details
Closed on
Nov 24, 2009
Sold by
Ehmcke Rickey L and Ehmcke Joan A
Bought by
Ehmcke Rickey L and Ehmcke Joan A
Current Estimated Value
Home Financials for this Owner
Home Financials are based on the most recent Mortgage that was taken out on this home.
Original Mortgage
$124,000
Outstanding Balance
$79,809
Interest Rate
4.88%
Mortgage Type
New Conventional
Estimated Equity
$392,873
Purchase Details
Closed on
Mar 18, 2009
Sold by
Ehmcke Rickey Lee and Ehmcke Joan Allison
Bought by
Ehmcke Rickey L and Ehmcke Joan A
Purchase Details
Closed on
Oct 6, 2005
Sold by
Lennar Reno Llc
Bought by
Ehmcke Rickey Lee and Ehmcke Joan Allison
Home Financials for this Owner
Home Financials are based on the most recent Mortgage that was taken out on this home.
Original Mortgage
$148,528
Interest Rate
5.63%
Mortgage Type
Fannie Mae Freddie Mac
Create a Home Valuation Report for This Property
The Home Valuation Report is an in-depth analysis detailing your home's value as well as a comparison with similar homes in the area
Home Values in the Area
Average Home Value in this Area
Purchase History
| Date | Buyer | Sale Price | Title Company |
|---|---|---|---|
| Ehmcke Rickey L | -- | Western Title Company | |
| Ehmcke Rickey L | -- | Western Title Inc Ridge | |
| Ehmcke Rickey L | -- | None Available | |
| Ehmcke Rickey Lee | $299,000 | Ticor Title Of Nevada Inc |
Source: Public Records
Mortgage History
| Date | Status | Borrower | Loan Amount |
|---|---|---|---|
| Open | Ehmcke Rickey L | $124,000 | |
| Closed | Ehmcke Rickey Lee | $148,528 |
Source: Public Records
Tax History
| Year | Tax Paid | Tax Assessment Tax Assessment Total Assessment is a certain percentage of the fair market value that is determined by local assessors to be the total taxable value of land and additions on the property. | Land | Improvement |
|---|---|---|---|---|
| 2026 | -- | $110,013 | $34,230 | $75,783 |
| 2024 | $1,990 | $106,697 | $29,295 | $77,402 |
| 2023 | $1,990 | $102,507 | $29,358 | $73,149 |
| 2022 | $1,932 | $86,682 | $25,795 | $60,887 |
| 2021 | $1,879 | $83,039 | $22,540 | $60,499 |
| 2020 | $1,820 | $83,012 | $22,540 | $60,472 |
| 2019 | $1,767 | $79,839 | $21,420 | $58,419 |
| 2018 | $1,715 | $72,191 | $15,085 | $57,106 |
| 2017 | $1,665 | $70,740 | $13,615 | $57,125 |
| 2016 | $1,623 | $69,854 | $11,725 | $58,129 |
| 2015 | $401 | $64,502 | $10,150 | $54,352 |
| 2014 | $1,541 | $51,553 | $8,225 | $43,328 |
| 2013 | -- | $40,761 | $6,790 | $33,971 |
Source: Public Records
Map
Nearby Homes
- 8921 Quail Falls Dr
- 8854 Finnsech Dr
- 8994 Wynne St
- 7709 Sandy Valley Dr
- 737 Valmy Dr
- 673 Mcgill Dr
- 9190 Streagle Way
- 8960 Wolf River Dr
- 632 Coyote Bluff Ct
- 636 Coyote Bluff Ct
- 8976 Quail Falls Dr
- 8961 Buffalo Grove Dr
- 9015 Quail Grove Dr
- 9232 Atoll Dr
- 9021 Antelope Pass Dr
- 7559 Editor Dr
- 7626 Avid Dr
- 509 Paradise Valley Rd
- 7587 Plump Jack Ln
- 7540 Editor Dr
- 8915 Sorcha St Unit 2
- 8903 Sorcha St Unit 2
- 8910 Wynne St
- 8921 Sorcha St
- 8916 Wynne St
- 8904 Wynne St
- 8189 Sorcha St
- 8910 Sorcha St
- 8916 Sorcha St
- 8922 Wynne St
- 8904 Sorcha St
- 8902 Wynne St
- 8927 Sorcha St Unit 2
- 8900 Sorcha St
- 8928 Wynne St
- 8928 Sorcha St
- 8935 Sorcha St
- 9032 Gilvarry St
- 9040 Gilvarry St
- 8909 Wynne St
Your Personal Tour Guide
Ask me questions while you tour the home.