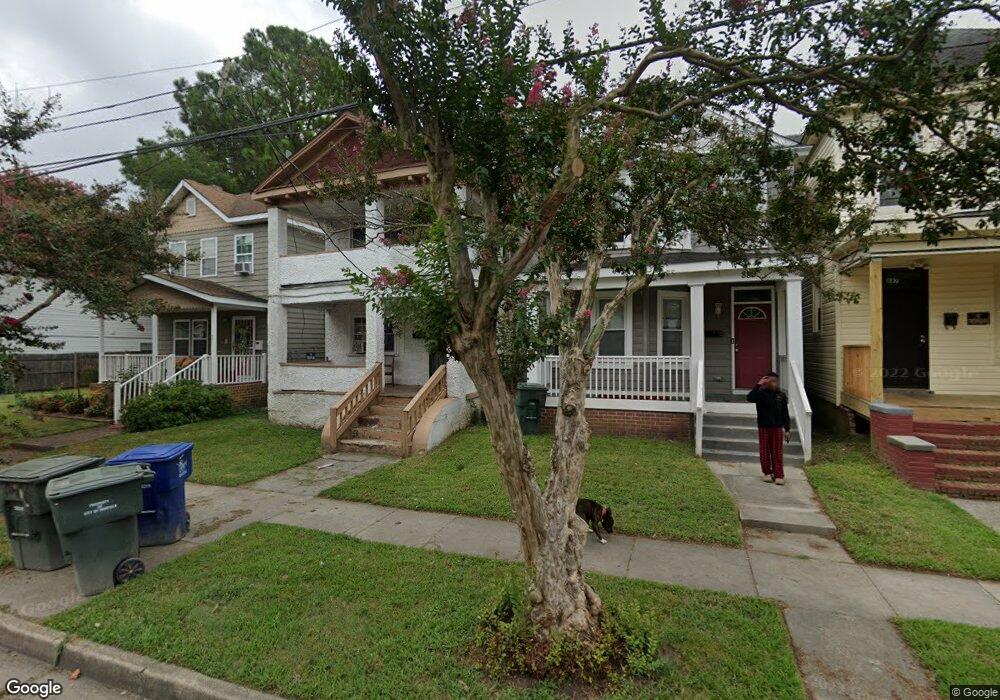
891 A Ave Norfolk, VA 23504
Olde Huntersville NeighborhoodEstimated Value: $183,000 - $211,000
4
Beds
2
Baths
1,354
Sq Ft
$142/Sq Ft
Est. Value
About This Home
This home is located at 891 A Ave, Norfolk, VA 23504 and is currently estimated at $192,363, approximately $142 per square foot. 891 A Ave is a home located in Norfolk City with nearby schools including Jacox Elementary School, Blair Middle School, and Granby High School.
Ownership History
Date
Name
Owned For
Owner Type
Purchase Details
Closed on
Dec 7, 2021
Sold by
Gordon Investment Properties Llc
Bought by
Wilkins Francine L
Current Estimated Value
Purchase Details
Closed on
Oct 19, 2010
Sold by
Fannie Mae
Bought by
Gordon William V
Purchase Details
Closed on
Sep 1, 2010
Sold by
Ba Francois Regis P
Bought by
Federal National Mortgage Association
Purchase Details
Closed on
May 18, 2007
Sold by
Campbell Peter D
Bought by
Philippe Ba Francois Regis
Home Financials for this Owner
Home Financials are based on the most recent Mortgage that was taken out on this home.
Original Mortgage
$25,500
Interest Rate
8.12%
Mortgage Type
Stand Alone Second
Purchase Details
Closed on
Mar 6, 2006
Sold by
Thurston Alison L
Bought by
Campbell Ii Peter D
Home Financials for this Owner
Home Financials are based on the most recent Mortgage that was taken out on this home.
Original Mortgage
$27,000
Interest Rate
6.16%
Mortgage Type
New Conventional
Purchase Details
Closed on
Jun 6, 2005
Sold by
Bennett Anita C
Bought by
Thurston Alison L
Create a Home Valuation Report for This Property
The Home Valuation Report is an in-depth analysis detailing your home's value as well as a comparison with similar homes in the area
Home Values in the Area
Average Home Value in this Area
Purchase History
| Date | Buyer | Sale Price | Title Company |
|---|---|---|---|
| Wilkins Francine L | $140,000 | Fidelity National Title | |
| Gordon William V | $25,000 | -- | |
| Federal National Mortgage Association | $73,100 | None Available | |
| Philippe Ba Francois Regis | $170,000 | None Available | |
| Campbell Ii Peter D | $135,000 | -- | |
| Thurston Alison L | $94,000 | -- |
Source: Public Records
Mortgage History
| Date | Status | Borrower | Loan Amount |
|---|---|---|---|
| Previous Owner | Philippe Ba Francois Regis | $25,500 | |
| Previous Owner | Philippe Ba Francois Regis | $127,500 | |
| Previous Owner | Campbell Ii Peter D | $27,000 |
Source: Public Records
Tax History Compared to Growth
Tax History
| Year | Tax Paid | Tax Assessment Tax Assessment Total Assessment is a certain percentage of the fair market value that is determined by local assessors to be the total taxable value of land and additions on the property. | Land | Improvement |
|---|---|---|---|---|
| 2025 | $2,226 | $178,100 | $29,500 | $148,600 |
| 2024 | $2,033 | $165,300 | $29,500 | $135,800 |
| 2023 | $1,978 | $158,200 | $29,500 | $128,700 |
| 2022 | $1,731 | $138,500 | $20,400 | $118,100 |
| 2021 | $1,515 | $113,400 | $17,000 | $96,400 |
| 2020 | $1,418 | $113,400 | $17,000 | $96,400 |
| 2019 | $1,269 | $101,500 | $17,000 | $84,500 |
| 2018 | $1,288 | $103,000 | $17,000 | $86,000 |
| 2017 | $1,186 | $103,100 | $17,000 | $86,100 |
| 2016 | $1,163 | $97,900 | $17,000 | $80,900 |
| 2015 | $1,114 | $97,900 | $17,000 | $80,900 |
| 2014 | $1,114 | $97,900 | $17,000 | $80,900 |
Source: Public Records
Map
Nearby Homes