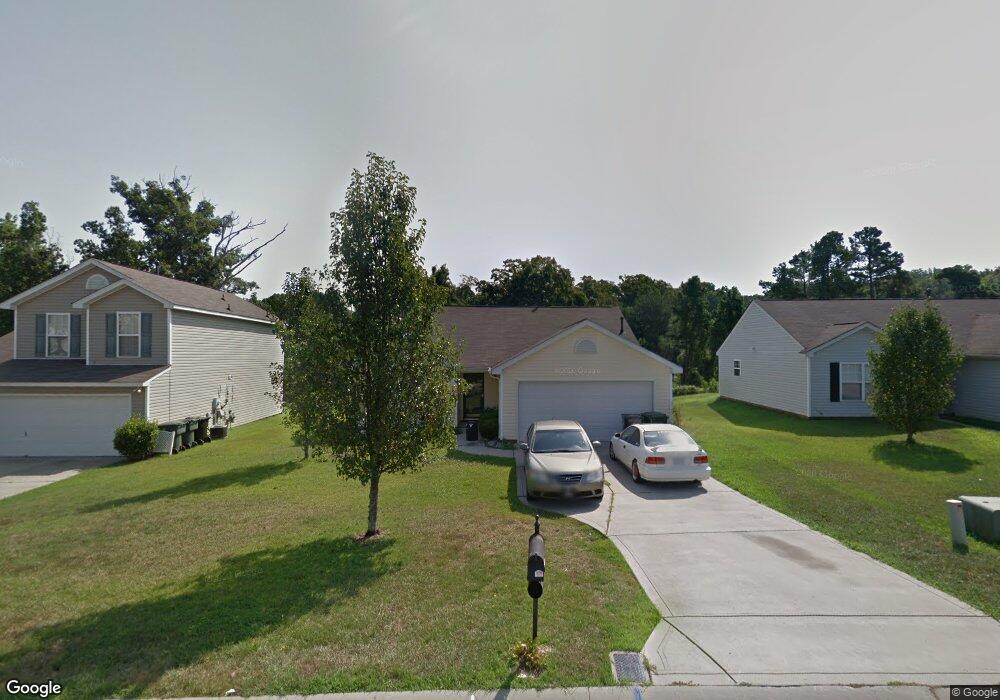
891 Anchor Way NE Kannapolis, NC 28083
Estimated Value: $279,000 - $282,000
3
Beds
2
Baths
1,248
Sq Ft
$225/Sq Ft
Est. Value
About This Home
This home is located at 891 Anchor Way NE, Kannapolis, NC 28083 and is currently estimated at $280,432, approximately $224 per square foot. 891 Anchor Way NE is a home located in Cabarrus County with nearby schools including Forest Park Elementary School, Kannapolis Middle, and A.L. Brown High School.
Ownership History
Date
Name
Owned For
Owner Type
Purchase Details
Closed on
Nov 2, 2018
Sold by
Southerland Simone M
Bought by
Sfr Jv 1 Property Llc
Current Estimated Value
Purchase Details
Closed on
Aug 20, 2008
Sold by
Emc Mortgage Corp
Bought by
Southerland Simone M
Home Financials for this Owner
Home Financials are based on the most recent Mortgage that was taken out on this home.
Original Mortgage
$72,400
Interest Rate
5.37%
Mortgage Type
Purchase Money Mortgage
Purchase Details
Closed on
Nov 6, 2007
Sold by
Rollins Terry and Rollins Tonya
Bought by
Emc Mortgage Corp
Purchase Details
Closed on
Mar 28, 2002
Sold by
Crossmann Communities Of Nc Inc
Bought by
Rollins Terry and Rollins Tonya
Home Financials for this Owner
Home Financials are based on the most recent Mortgage that was taken out on this home.
Original Mortgage
$115,049
Interest Rate
6.85%
Mortgage Type
FHA
Create a Home Valuation Report for This Property
The Home Valuation Report is an in-depth analysis detailing your home's value as well as a comparison with similar homes in the area
Home Values in the Area
Average Home Value in this Area
Purchase History
| Date | Buyer | Sale Price | Title Company |
|---|---|---|---|
| Sfr Jv 1 Property Llc | $149,000 | None Available | |
| Southerland Simone M | $90,500 | None Available | |
| Emc Mortgage Corp | $92,650 | None Available | |
| Rollins Terry | $117,000 | -- |
Source: Public Records
Mortgage History
| Date | Status | Borrower | Loan Amount |
|---|---|---|---|
| Previous Owner | Southerland Simone M | $72,400 | |
| Previous Owner | Rollins Terry | $115,049 |
Source: Public Records
Tax History
| Year | Tax Paid | Tax Assessment Tax Assessment Total Assessment is a certain percentage of the fair market value that is determined by local assessors to be the total taxable value of land and additions on the property. | Land | Improvement |
|---|---|---|---|---|
| 2025 | $2,878 | $288,940 | $59,000 | $229,940 |
| 2024 | $2,878 | $288,940 | $59,000 | $229,940 |
| 2023 | $1,902 | $155,940 | $35,000 | $120,940 |
| 2022 | $1,902 | $155,940 | $35,000 | $120,940 |
| 2021 | $1,902 | $155,940 | $35,000 | $120,940 |
| 2020 | $1,902 | $155,940 | $35,000 | $120,940 |
| 2019 | $1,372 | $112,460 | $19,000 | $93,460 |
| 2018 | $1,255 | $104,600 | $19,000 | $85,600 |
| 2017 | $1,234 | $104,600 | $19,000 | $85,600 |
| 2016 | $732 | $109,120 | $24,000 | $85,120 |
| 2015 | $1,288 | $109,120 | $24,000 | $85,120 |
| 2014 | $1,288 | $109,120 | $24,000 | $85,120 |
Source: Public Records
Map
Nearby Homes
- 2640 Centergrove Rd
- 2495 Centergrove Rd
- 2882 Centergrove Rd
- 2124 Clear Brook Dr
- 1838 Summit Ridge Ln
- 111 Austin Run Ct
- 2020 Quill Ct
- 2458 Saguaro Ln
- 3215 Penny Earley Ln
- 3246 Camp Julia Rd
- 2485 Acadia Ct
- 2271 Knowles St
- 2707 Ireton Place
- 3397 Camp Julia Rd
- 00 Dixie Dr
- 2402 Brantley Rd
- 307 S Little Texas Rd
- 1433 Midlake Rd
- 108 S Little Texas Rd
- 1365 Eagle Claw Dr
- 891 Anchor Way NE Unit 84
- 895 Anchor Way NE
- 887 Anchor Way NE
- 899 Anchor Way NE
- 883 Anchor Way NE
- 2606 Lookout Point Rd
- 2606 Lookout Point Rd Unit 191
- 903 Anchor Way NE
- 879 Anchor Way NE
- 886 Anchor Way NE
- 882 Anchor Way NE
- 882 Anchor Way NE
- 882 Anchor Way NE Unit 193
- 907 Anchor Way NE
- 875 Anchor Way NE
- 878 Anchor Way NE
- 902 Anchor Way NE
- 2610 Lookout Point Rd
- 2610 Lookout Point NE
- 874 Anchor Way NE
Your Personal Tour Guide
Ask me questions while you tour the home.