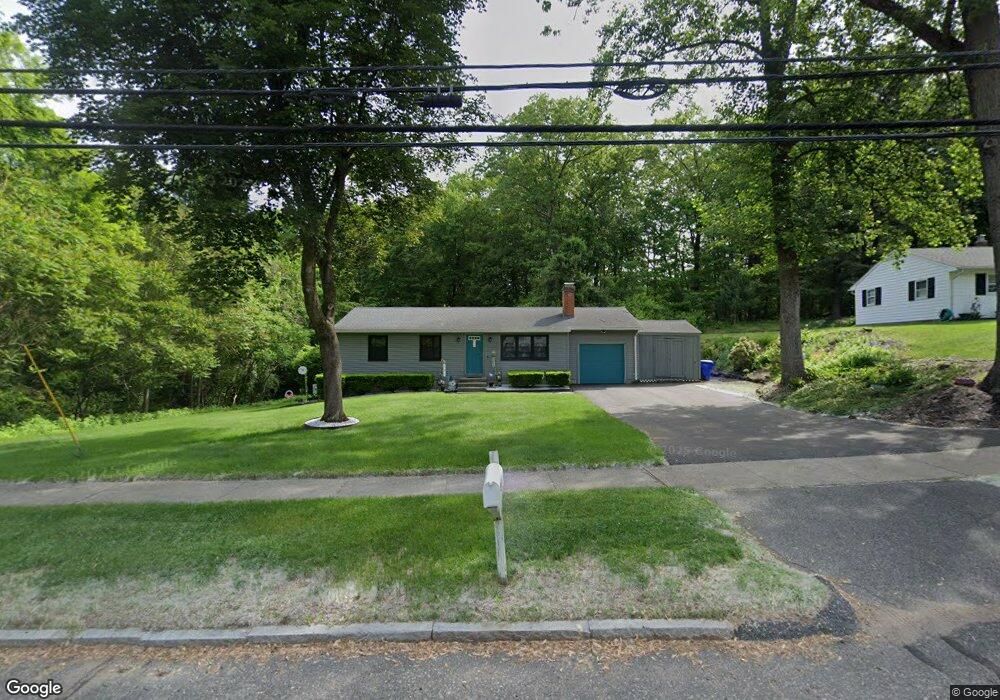
891 Bradley Rd Springfield, MA 01109
Sixteen Acres NeighborhoodEstimated Value: $268,000 - $290,443
3
Beds
1
Bath
864
Sq Ft
$319/Sq Ft
Est. Value
About This Home
This home is located at 891 Bradley Rd, Springfield, MA 01109 and is currently estimated at $275,861, approximately $319 per square foot. 891 Bradley Rd is a home located in Hampden County with nearby schools including Frank H. Freedman School, John J Duggan Middle, and Springfield High School of Science and Technology.
Ownership History
Date
Name
Owned For
Owner Type
Purchase Details
Closed on
Aug 28, 1996
Sold by
Neylon Brian T and Neylon Matilda M
Bought by
Pinney Ellen A
Current Estimated Value
Home Financials for this Owner
Home Financials are based on the most recent Mortgage that was taken out on this home.
Original Mortgage
$63,000
Interest Rate
8.18%
Mortgage Type
Purchase Money Mortgage
Create a Home Valuation Report for This Property
The Home Valuation Report is an in-depth analysis detailing your home's value as well as a comparison with similar homes in the area
Home Values in the Area
Average Home Value in this Area
Purchase History
| Date | Buyer | Sale Price | Title Company |
|---|---|---|---|
| Pinney Ellen A | $70,000 | -- |
Source: Public Records
Mortgage History
| Date | Status | Borrower | Loan Amount |
|---|---|---|---|
| Open | Pinney Ellen A | $61,000 | |
| Closed | Pinney Ellen A | $63,000 |
Source: Public Records
Tax History Compared to Growth
Tax History
| Year | Tax Paid | Tax Assessment Tax Assessment Total Assessment is a certain percentage of the fair market value that is determined by local assessors to be the total taxable value of land and additions on the property. | Land | Improvement |
|---|---|---|---|---|
| 2025 | $3,856 | $245,900 | $67,400 | $178,500 |
| 2024 | $3,923 | $244,300 | $67,400 | $176,900 |
| 2023 | $3,422 | $200,700 | $64,200 | $136,500 |
| 2022 | $3,583 | $190,400 | $64,200 | $126,200 |
| 2021 | $3,181 | $168,300 | $58,400 | $109,900 |
| 2020 | $3,211 | $164,400 | $58,400 | $106,000 |
| 2019 | $2,980 | $151,400 | $58,400 | $93,000 |
| 2018 | $2,737 | $139,100 | $58,400 | $80,700 |
| 2017 | $2,756 | $140,200 | $63,400 | $76,800 |
| 2016 | $2,672 | $135,900 | $63,400 | $72,500 |
| 2015 | $2,636 | $134,000 | $63,400 | $70,600 |
Source: Public Records
Map
Nearby Homes