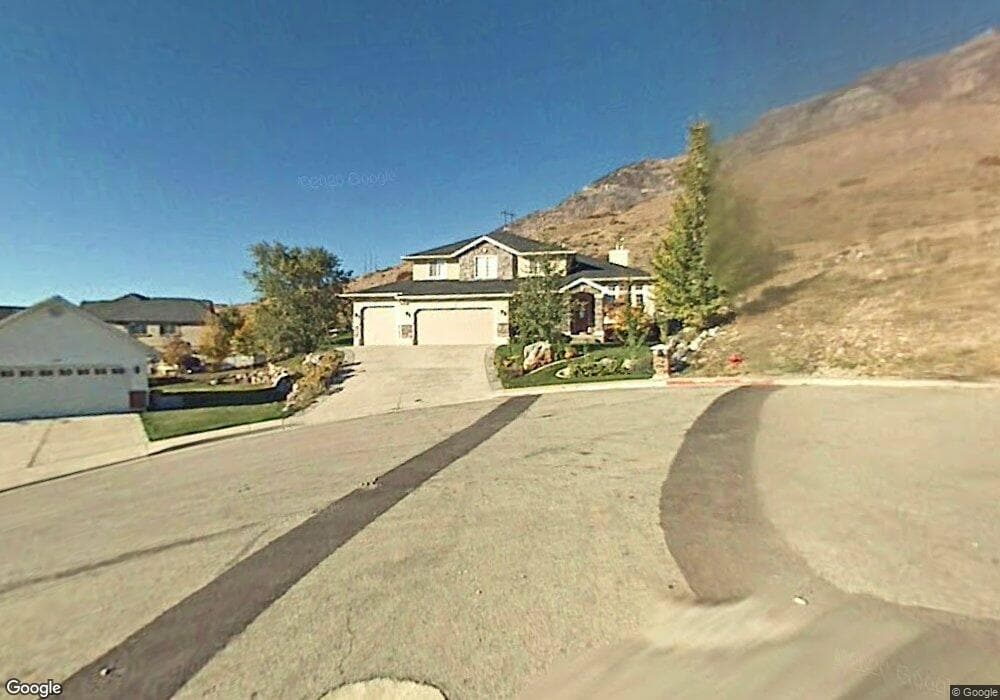
891 E 1190 N Pleasant Grove, UT 84062
Estimated Value: $693,000 - $773,000
4
Beds
3
Baths
2,468
Sq Ft
$299/Sq Ft
Est. Value
About This Home
This home is located at 891 E 1190 N, Pleasant Grove, UT 84062 and is currently estimated at $738,372, approximately $299 per square foot. 891 E 1190 N is a home located in Utah County with nearby schools including Grovecrest Elementary School, Pleasant Grove Junior High School, and Pleasant Grove High School.
Ownership History
Date
Name
Owned For
Owner Type
Purchase Details
Closed on
Nov 7, 2006
Sold by
King Keith E and Eckert Griffin Jaimee
Bought by
King Keith E and Eckert Griffin Jaimee
Current Estimated Value
Purchase Details
Closed on
Dec 30, 2005
Sold by
King Keith E and Eckert Griffin Jaimee
Bought by
King Keith E and Eckert Griffin Jaimee
Purchase Details
Closed on
Sep 30, 2005
Sold by
Bond Michael L and Bond Janet S
Bought by
Eckert King Keith E and Eckert Griffin Jaimee
Purchase Details
Closed on
Apr 16, 1998
Sold by
Bond Mike L and Bond Janet S
Bought by
Bond Michael L and Bond Janet S
Purchase Details
Closed on
Nov 15, 1997
Sold by
Bond Mike L
Bought by
Bond Mike L and Bond Janet S
Home Financials for this Owner
Home Financials are based on the most recent Mortgage that was taken out on this home.
Original Mortgage
$107,950
Interest Rate
7.23%
Mortgage Type
Construction
Create a Home Valuation Report for This Property
The Home Valuation Report is an in-depth analysis detailing your home's value as well as a comparison with similar homes in the area
Home Values in the Area
Average Home Value in this Area
Purchase History
| Date | Buyer | Sale Price | Title Company |
|---|---|---|---|
| King Keith E | -- | Title West Title Company | |
| King Keith E | -- | Select Title Insurance Agen | |
| Eckert King Keith E | -- | Title West Title Company | |
| Bond Michael L | -- | -- | |
| Bond Mike L | -- | -- |
Source: Public Records
Mortgage History
| Date | Status | Borrower | Loan Amount |
|---|---|---|---|
| Previous Owner | Bond Mike L | $107,950 |
Source: Public Records
Tax History
| Year | Tax Paid | Tax Assessment Tax Assessment Total Assessment is a certain percentage of the fair market value that is determined by local assessors to be the total taxable value of land and additions on the property. | Land | Improvement |
|---|---|---|---|---|
| 2025 | $2,759 | $361,405 | -- | -- |
| 2024 | $2,759 | $329,285 | $0 | $0 |
| 2023 | $2,692 | $328,845 | $0 | $0 |
| 2022 | $2,742 | $333,355 | $0 | $0 |
| 2021 | $2,494 | $461,700 | $173,900 | $287,800 |
| 2020 | $2,285 | $414,600 | $155,300 | $259,300 |
| 2019 | $2,122 | $398,200 | $147,600 | $250,600 |
| 2018 | $2,049 | $363,500 | $139,800 | $223,700 |
| 2017 | $2,026 | $191,400 | $0 | $0 |
| 2016 | $1,930 | $176,055 | $0 | $0 |
| 2015 | $1,968 | $169,950 | $0 | $0 |
| 2014 | $1,942 | $166,155 | $0 | $0 |
Source: Public Records
Map
Nearby Homes
- 899 E 1190 N
- 540 E 990 N
- 861 N 1100 E
- 429 E 1600 N
- 641 E 700 N
- 1699 N Siena Cir Unit 5
- 1018 E 300 S Unit 2
- 1099 E 110 S Unit 124A
- 1012 E 300 S Unit 3
- 344 E 900 N
- 825 N 350 E
- 563 E 500 N Unit 3
- 557 E 200 N Unit 2
- 1633 N 150 E
- 525 E 200 N
- 1161 E 200 N
- 1184 E 300 N
- 612 E 100 N
- 851 E Center St
- 642 E Center St
Your Personal Tour Guide
Ask me questions while you tour the home.