Estimated Value: $239,876 - $320,000
3
Beds
1
Bath
1,592
Sq Ft
$168/Sq Ft
Est. Value
About This Home
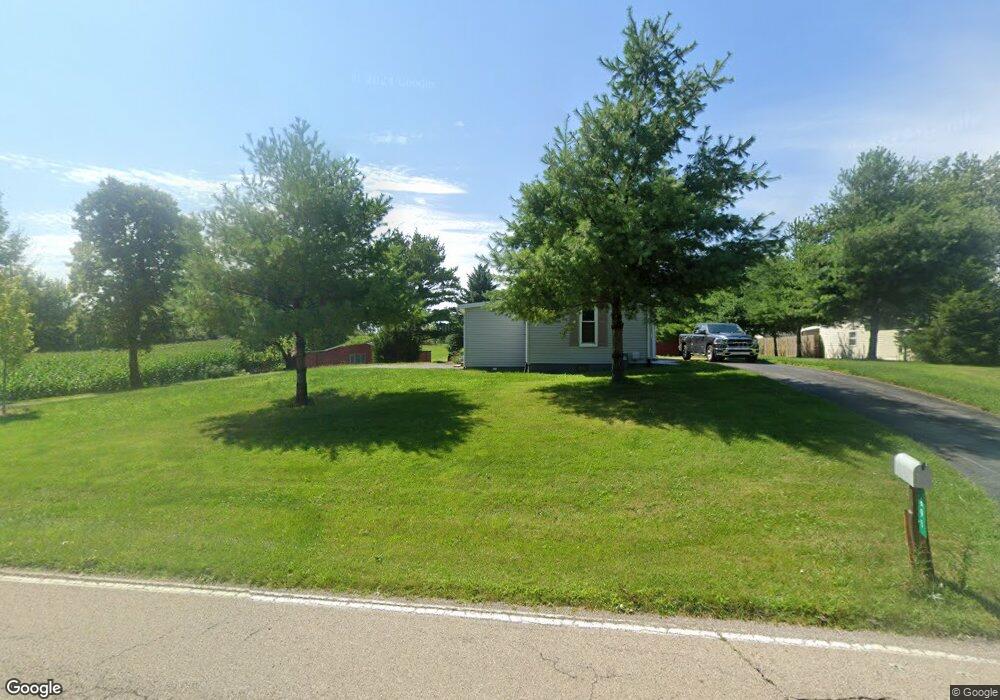
This home is located at 891 Hook Rd, Xenia, OH 45385 and is currently estimated at $266,969, approximately $167 per square foot. 891 Hook Rd is a home located in Greene County with nearby schools including Xenia High School, Summit Academy Community School for Alternative Learners - Xenia, and Legacy Christian Academy.
Ownership History
Date
Name
Owned For
Owner Type
Purchase Details
Closed on
Apr 29, 2021
Sold by
Hochwalt Nicole and Gutierrez Nicole
Bought by
Gutierrez Nicole and Gutierrez Efren
Current Estimated Value
Purchase Details
Closed on
Aug 21, 2020
Sold by
Phipps Beth A and Phipps John S
Bought by
Ringer Michael E and Ringer Sonja V
Home Financials for this Owner
Home Financials are based on the most recent Mortgage that was taken out on this home.
Original Mortgage
$147,283
Outstanding Balance
$130,650
Interest Rate
3%
Mortgage Type
FHA
Estimated Equity
$136,319
Purchase Details
Closed on
Aug 24, 1999
Sold by
Ringer Edward E and Ringer Linda L
Bought by
Ringer Edward E and Ringer Linda L
Create a Home Valuation Report for This Property
The Home Valuation Report is an in-depth analysis detailing your home's value as well as a comparison with similar homes in the area
Purchase History
| Date | Buyer | Sale Price | Title Company |
|---|---|---|---|
| Gutierrez Nicole | -- | None Available | |
| Ringer Michael E | $150,000 | None Available | |
| Ringer Edward E | -- | -- |
Source: Public Records
Mortgage History
| Date | Status | Borrower | Loan Amount |
|---|---|---|---|
| Open | Ringer Michael E | $147,283 |
Source: Public Records
Tax History
| Year | Tax Paid | Tax Assessment Tax Assessment Total Assessment is a certain percentage of the fair market value that is determined by local assessors to be the total taxable value of land and additions on the property. | Land | Improvement |
|---|---|---|---|---|
| 2024 | $3,024 | $61,690 | $21,560 | $40,130 |
| 2023 | $2,999 | $61,690 | $21,560 | $40,130 |
| 2022 | $2,695 | $50,250 | $18,750 | $31,500 |
| 2021 | $2,669 | $50,250 | $18,750 | $31,500 |
| 2020 | $2,118 | $50,250 | $18,750 | $31,500 |
| 2019 | $1,490 | $36,130 | $16,700 | $19,430 |
| 2018 | $1,493 | $36,130 | $16,700 | $19,430 |
| 2017 | $1,453 | $36,130 | $16,700 | $19,430 |
| 2016 | $1,424 | $34,380 | $16,170 | $18,210 |
| 2015 | $1,427 | $34,380 | $16,170 | $18,210 |
| 2014 | $1,370 | $34,380 | $16,170 | $18,210 |
Source: Public Records
Map
Nearby Homes
Your Personal Tour Guide
Ask me questions while you tour the home.