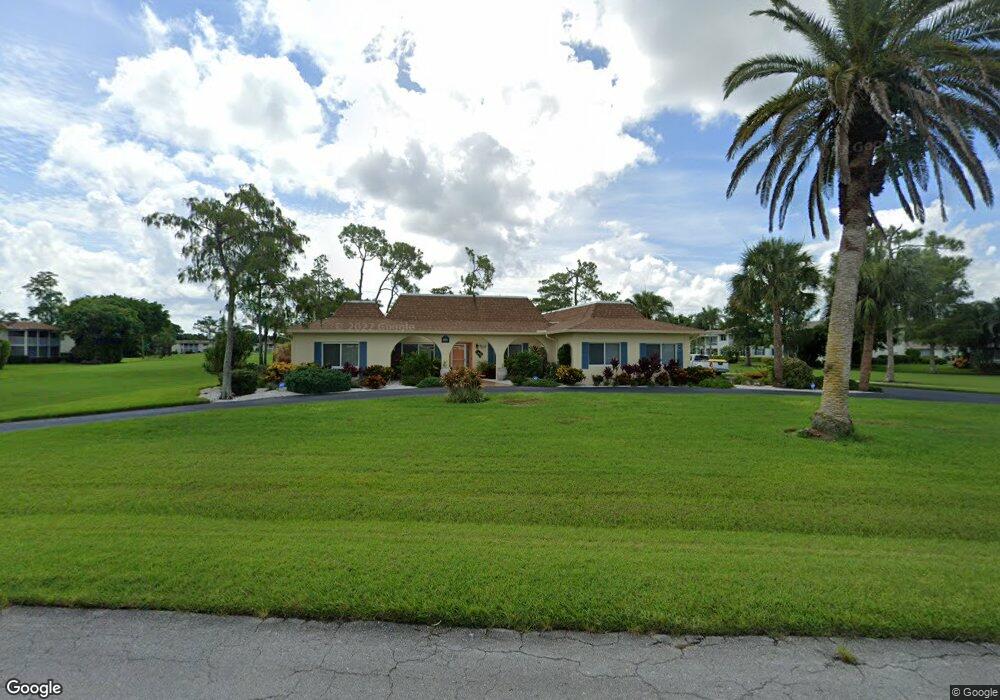
891 Teryl Rd Unit S Naples, FL 34112
East Naples NeighborhoodEstimated Value: $438,000 - $798,000
--
Bed
--
Bath
2,246
Sq Ft
$306/Sq Ft
Est. Value
About This Home
This home is located at 891 Teryl Rd Unit S, Naples, FL 34112 and is currently estimated at $687,350, approximately $306 per square foot. 891 Teryl Rd Unit S is a home located in Collier County with nearby schools including Shadowlawn Elementary School, East Naples Middle School, and Lely High School.
Ownership History
Date
Name
Owned For
Owner Type
Purchase Details
Closed on
Jul 8, 2021
Sold by
Darragh William E and Darragh William E
Bought by
Darragh William E and Darragh William E
Current Estimated Value
Purchase Details
Closed on
Feb 12, 2021
Sold by
Crist Debora A
Bought by
Darragh William E and Darragh William E
Purchase Details
Closed on
Mar 8, 2017
Sold by
Crist Debora A
Bought by
Crist Debora A
Purchase Details
Closed on
Mar 13, 2013
Sold by
Crist Kruzner Sheila
Bought by
Crist Debora A
Purchase Details
Closed on
Mar 11, 2013
Sold by
The Bank Of Kentucky
Bought by
Crist Kruzner Sheila
Purchase Details
Closed on
Feb 24, 2012
Sold by
Crist Debora A and Kruzner Sheila C
Bought by
Crist Debora A
Purchase Details
Closed on
Jan 7, 2011
Sold by
Crist Richard D
Bought by
Crist Debora A and Kruzner Sheila C
Purchase Details
Closed on
Mar 19, 2008
Sold by
Nauseda Lori A and Meador Kimberly
Bought by
Crist Richard D
Create a Home Valuation Report for This Property
The Home Valuation Report is an in-depth analysis detailing your home's value as well as a comparison with similar homes in the area
Home Values in the Area
Average Home Value in this Area
Purchase History
| Date | Buyer | Sale Price | Title Company |
|---|---|---|---|
| Darragh William E | -- | Accommodation | |
| Darragh William E | $595,000 | Stewart Title Company | |
| Crist Debora A | $150,000 | Attorney | |
| Crist Debora A | -- | Attorney | |
| Crist Kruzner Sheila | -- | Attorney | |
| Crist Debora A | -- | Attorney | |
| Crist Debora A | -- | None Available | |
| Crist Richard D | $469,000 | Attorney |
Source: Public Records
Tax History Compared to Growth
Tax History
| Year | Tax Paid | Tax Assessment Tax Assessment Total Assessment is a certain percentage of the fair market value that is determined by local assessors to be the total taxable value of land and additions on the property. | Land | Improvement |
|---|---|---|---|---|
| 2025 | $2,183 | $261,341 | -- | -- |
| 2024 | $2,155 | $253,976 | -- | -- |
| 2023 | $2,155 | $246,579 | $0 | $0 |
| 2022 | $2,210 | $239,397 | $0 | $0 |
| 2021 | $2,344 | $242,322 | $0 | $0 |
| 2020 | $2,289 | $238,976 | $0 | $0 |
| 2019 | $2,245 | $233,603 | $0 | $0 |
| 2018 | $2,192 | $229,247 | $0 | $0 |
| 2017 | $2,157 | $224,532 | $0 | $0 |
| 2016 | $2,115 | $219,914 | $0 | $0 |
| 2015 | $2,134 | $218,385 | $0 | $0 |
| 2014 | $2,139 | $166,652 | $0 | $0 |
Source: Public Records
Map
Nearby Homes
- 865 Teryl Rd Unit 2114
- 221 Quails Nest Rd Unit 1191
- 125 Penny Ln Unit 7
- 196 Peppermint Ln Unit 938
- 263 Candycane Ln Unit 5
- 833 Teryl Rd Unit 1
- 801 Teryl Rd Unit 2
- 116 Short Ct
- 355 Palm Dr Unit 732
- 185 Penny Ln Unit 4
- 185 Penny Ln Unit 3122
- 601 Teryl Rd Unit 2262
- 300 Palm Dr Unit 402
- 256 Palm Dr Unit 6
- 248 Palm Dr Unit 5
- 219 Palm Dr Unit 219-2
- 878 Teryl Rd Unit S
- 891 Teryl Rd Unit 1840
- 106 Wintergreen Way Unit 1773
- 106 Wintergreen Way Unit 1772
- 106 Wintergreen Way Unit 1771
- 112 Winding Way Unit 2
- 112 Winding Way Unit 4
- 112 Winding Way Unit 2004
- 112 Winding Way Unit 2003
- 112 Winding Way Unit 2002
- 112 Winding Way Unit 2001
- 124 Winding Way Unit 3
- 124 Winding Way Unit 2014
- 124 Winding Way Unit 2013
- 124 Winding Way Unit 2012
- 124 Winding Way Unit 2011
- 124 Winding Way Unit 2
- 100 Winding Way Unit 1992
- 100 Winding Way Unit 1993
- 100 Winding Way Unit 1991