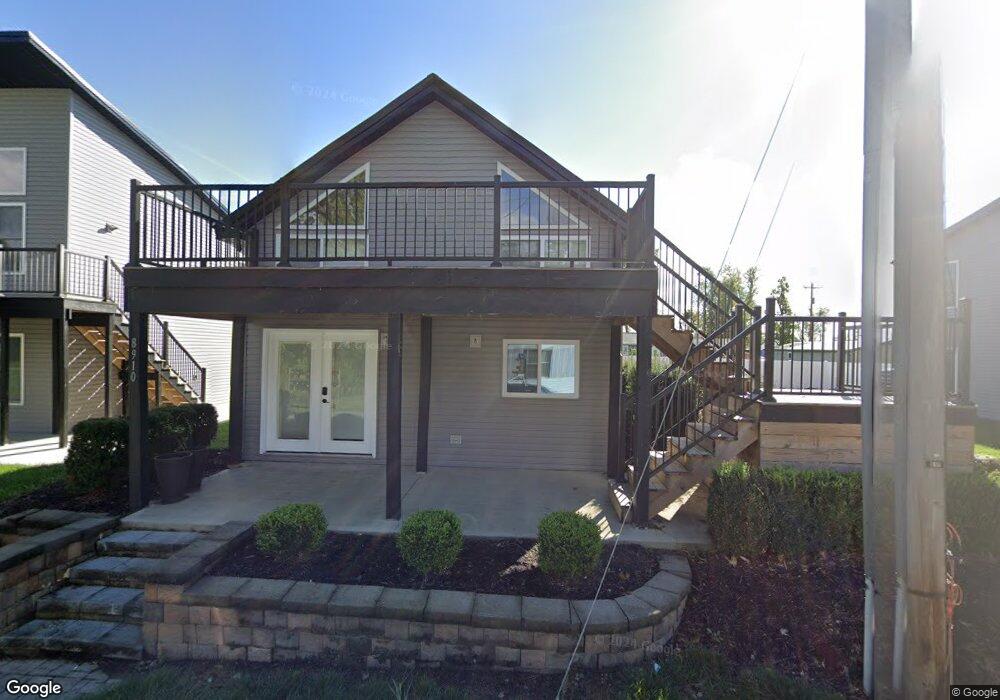
8910 Franklin Ave Unit 49N Lakeview, OH 43331
Estimated Value: $192,000 - $683,000
1
Bed
2
Baths
780
Sq Ft
$511/Sq Ft
Est. Value
About This Home
This home is located at 8910 Franklin Ave Unit 49N, Lakeview, OH 43331 and is currently estimated at $398,667, approximately $511 per square foot. 8910 Franklin Ave Unit 49N is a home located in Logan County with nearby schools including Indian Lake Elementary School, Indian Lake Middle School, and Indian Lake High School.
Ownership History
Date
Name
Owned For
Owner Type
Purchase Details
Closed on
Mar 30, 2021
Sold by
Npg Solutions Llc
Bought by
Moonlight Terrace Resorts Llc
Current Estimated Value
Home Financials for this Owner
Home Financials are based on the most recent Mortgage that was taken out on this home.
Original Mortgage
$634,865
Outstanding Balance
$523,503
Interest Rate
2.8%
Mortgage Type
Future Advance Clause Open End Mortgage
Estimated Equity
-$124,836
Purchase Details
Closed on
Sep 22, 2020
Sold by
Kieffer Evan D
Bought by
Nps Solutions Llc
Purchase Details
Closed on
Feb 3, 2017
Sold by
David C Diane Kieffer
Bought by
Kieffer Evan
Home Financials for this Owner
Home Financials are based on the most recent Mortgage that was taken out on this home.
Original Mortgage
$176,739
Interest Rate
4.19%
Purchase Details
Closed on
Nov 10, 2003
Bought by
Kieffer David C
Purchase Details
Closed on
Aug 19, 2002
Bought by
Walter Edward A
Create a Home Valuation Report for This Property
The Home Valuation Report is an in-depth analysis detailing your home's value as well as a comparison with similar homes in the area
Home Values in the Area
Average Home Value in this Area
Purchase History
| Date | Buyer | Sale Price | Title Company |
|---|---|---|---|
| Moonlight Terrace Resorts Llc | -- | None Available | |
| Moonlight Terrace Resorts Llc | -- | None Listed On Document | |
| Nps Solutions Llc | $215,000 | None Available | |
| Kieffer Evan | -- | -- | |
| Kieffer David C | $36,000 | -- | |
| Walter Edward A | $45,000 | -- |
Source: Public Records
Mortgage History
| Date | Status | Borrower | Loan Amount |
|---|---|---|---|
| Open | Moonlight Terrace Resorts Llc | $634,865 | |
| Closed | Moonlight Terrace Resorts Llc | $634,865 | |
| Previous Owner | Kieffer Evan | $176,739 | |
| Previous Owner | Kieffer Evan | -- |
Source: Public Records
Tax History Compared to Growth
Tax History
| Year | Tax Paid | Tax Assessment Tax Assessment Total Assessment is a certain percentage of the fair market value that is determined by local assessors to be the total taxable value of land and additions on the property. | Land | Improvement |
|---|---|---|---|---|
| 2024 | $1,835 | $62,770 | $1,980 | $60,790 |
| 2023 | $1,835 | $62,770 | $1,980 | $60,790 |
| 2022 | $2,558 | $62,610 | $1,100 | $61,510 |
| 2021 | $2,864 | $62,610 | $1,100 | $61,510 |
| 2020 | $2,811 | $25,220 | $1,930 | $23,290 |
| 2019 | $1,044 | $25,220 | $1,930 | $23,290 |
| 2018 | $1,195 | $25,220 | $1,930 | $23,290 |
| 2016 | $1,069 | $24,010 | $1,830 | $22,180 |
| 2014 | $1,029 | $24,010 | $1,830 | $22,180 |
| 2013 | $973 | $24,010 | $1,830 | $22,180 |
| 2012 | $935 | $22,540 | $980 | $21,560 |
Source: Public Records
Map
Nearby Homes
- 8910 Franklin Ave
- 8918 Franklin Ave
- 8926 Franklin Ave
- 8898 Franklin Ave
- 8888 Franklin Ave
- 8919 Lake Ave
- 266 Township Rd Unit 58
- 000 Township Rd
- 10009 Township Rd
- 13854 Township Rd
- 10935 Township Rd
- 11562 Township Rd
- 8899 Lake Ave
- 8929 Lake Ave
- 8901 Franklin Ave
- 8867 Township Rd
- 8889 Lake Ave
- 10773 Ohio 366
- 10781 State Route 366
- 10765 State Route 366