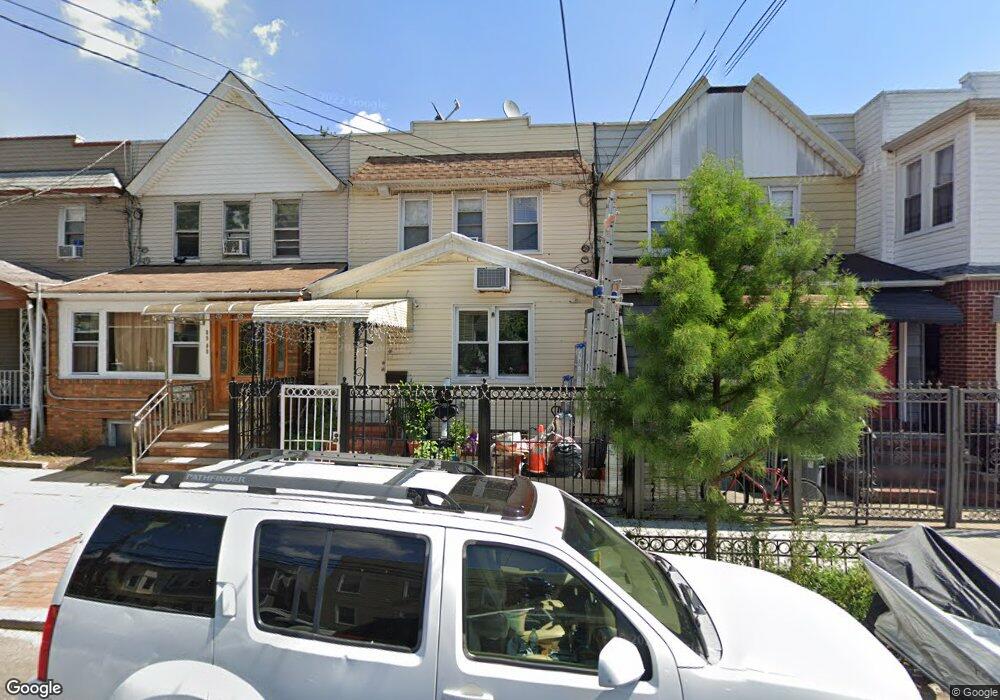
8911 80th St Woodhaven, NY 11421
Woodhaven NeighborhoodEstimated Value: $856,000 - $1,134,000
--
Bed
--
Bath
1,804
Sq Ft
$570/Sq Ft
Est. Value
About This Home
This home is located at 8911 80th St, Woodhaven, NY 11421 and is currently estimated at $1,027,667, approximately $569 per square foot. 8911 80th St is a home located in Queens County with nearby schools including P.S. 060 Woodhaven, Santiam Elementary School, and Alice Ott Middle School.
Ownership History
Date
Name
Owned For
Owner Type
Purchase Details
Closed on
May 29, 2003
Sold by
Donayre Esmeralda
Bought by
Donayre Esmeralda and Donayre Humberto
Current Estimated Value
Purchase Details
Closed on
Mar 18, 2002
Sold by
Better Homes Depot Inc
Bought by
Danayre Esmeralda
Home Financials for this Owner
Home Financials are based on the most recent Mortgage that was taken out on this home.
Original Mortgage
$279,200
Outstanding Balance
$113,649
Interest Rate
6.84%
Mortgage Type
Purchase Money Mortgage
Estimated Equity
$914,018
Purchase Details
Closed on
Dec 7, 2001
Sold by
Baker Cynthia and Valencia Fanny Def
Bought by
Better Homes Depot
Purchase Details
Closed on
Feb 25, 1999
Sold by
Valencia Fanny and Valencia Wilson
Bought by
Valencia Juan and Valencia Leonor
Create a Home Valuation Report for This Property
The Home Valuation Report is an in-depth analysis detailing your home's value as well as a comparison with similar homes in the area
Home Values in the Area
Average Home Value in this Area
Purchase History
| Date | Buyer | Sale Price | Title Company |
|---|---|---|---|
| Donayre Esmeralda | -- | -- | |
| Donayre Esmeralda | -- | -- | |
| Danayre Esmeralda | -- | -- | |
| Danayre Esmeralda | -- | -- | |
| Better Homes Depot | -- | -- | |
| Better Homes Depot | -- | -- | |
| Valencia Juan | -- | -- | |
| Valencia Juan | -- | -- |
Source: Public Records
Mortgage History
| Date | Status | Borrower | Loan Amount |
|---|---|---|---|
| Open | Danayre Esmeralda | $279,200 | |
| Closed | Danayre Esmeralda | $279,200 |
Source: Public Records
Tax History Compared to Growth
Tax History
| Year | Tax Paid | Tax Assessment Tax Assessment Total Assessment is a certain percentage of the fair market value that is determined by local assessors to be the total taxable value of land and additions on the property. | Land | Improvement |
|---|---|---|---|---|
| 2025 | $6,441 | $33,799 | $7,685 | $26,114 |
| 2024 | $6,441 | $32,069 | $7,539 | $24,530 |
| 2023 | $6,077 | $30,257 | $7,390 | $22,867 |
| 2022 | $5,960 | $41,160 | $12,060 | $29,100 |
| 2021 | $5,928 | $38,580 | $12,060 | $26,520 |
| 2020 | $5,962 | $42,420 | $12,060 | $30,360 |
| 2019 | $5,590 | $37,140 | $12,060 | $25,080 |
| 2018 | $5,140 | $25,214 | $7,000 | $18,214 |
| 2017 | $5,072 | $24,879 | $9,330 | $15,549 |
| 2016 | $4,692 | $24,879 | $9,330 | $15,549 |
| 2015 | $2,611 | $23,472 | $11,632 | $11,840 |
| 2014 | $2,611 | $22,270 | $12,447 | $9,823 |
Source: Public Records
Map
Nearby Homes