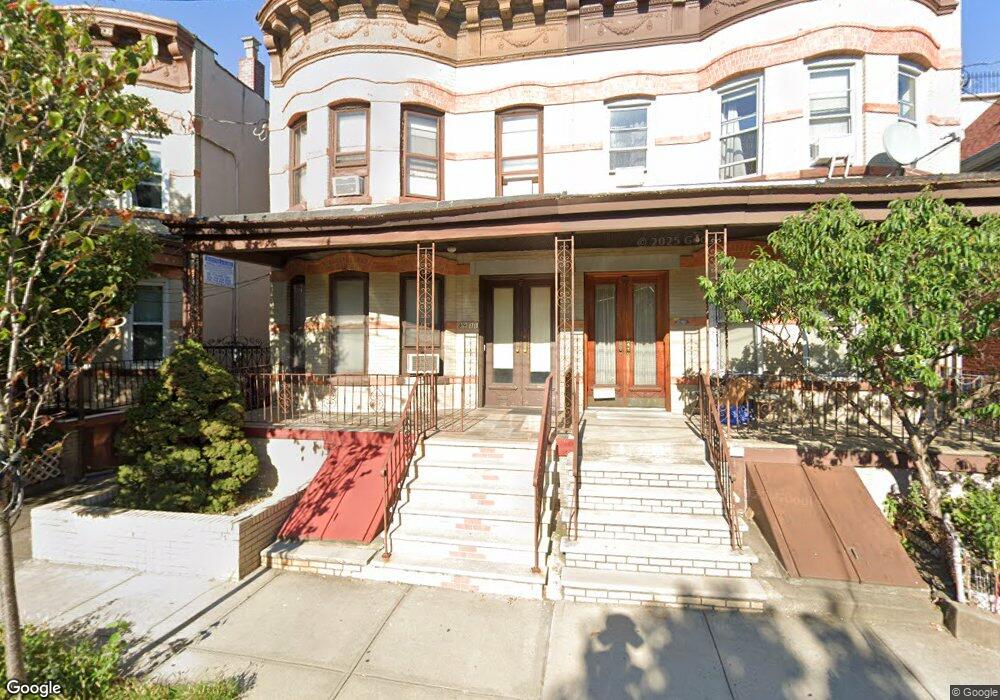
8911 87th St Woodhaven, NY 11421
Woodhaven NeighborhoodEstimated Value: $825,039 - $1,012,000
--
Bed
--
Bath
2,140
Sq Ft
$435/Sq Ft
Est. Value
About This Home
This home is located at 8911 87th St, Woodhaven, NY 11421 and is currently estimated at $931,760, approximately $435 per square foot. 8911 87th St is a home located in Queens County with nearby schools including P.S. 060 Woodhaven, Jhs 210 Elizabeth Blackwell, and St. Thomas the Apostle Catholic Academy.
Ownership History
Date
Name
Owned For
Owner Type
Purchase Details
Closed on
May 21, 1998
Sold by
Kirschner Eugene and Kirschner Joan
Bought by
Faniete Antonio and Gonzalez Emilia
Current Estimated Value
Home Financials for this Owner
Home Financials are based on the most recent Mortgage that was taken out on this home.
Original Mortgage
$186,095
Interest Rate
6.76%
Mortgage Type
FHA
Purchase Details
Closed on
Jul 18, 1995
Sold by
Miller Concetta and Miller Edward
Bought by
Kirschner Joan and Kirschner Eugene
Create a Home Valuation Report for This Property
The Home Valuation Report is an in-depth analysis detailing your home's value as well as a comparison with similar homes in the area
Home Values in the Area
Average Home Value in this Area
Purchase History
| Date | Buyer | Sale Price | Title Company |
|---|---|---|---|
| Faniete Antonio | $185,500 | First American Title Ins Co | |
| Kirschner Joan | -- | Chicago Title Insurance Co |
Source: Public Records
Mortgage History
| Date | Status | Borrower | Loan Amount |
|---|---|---|---|
| Previous Owner | Faniete Antonio | $186,095 |
Source: Public Records
Tax History Compared to Growth
Tax History
| Year | Tax Paid | Tax Assessment Tax Assessment Total Assessment is a certain percentage of the fair market value that is determined by local assessors to be the total taxable value of land and additions on the property. | Land | Improvement |
|---|---|---|---|---|
| 2025 | $7,131 | $39,115 | $10,854 | $28,261 |
| 2024 | $7,143 | $36,902 | $10,780 | $26,122 |
| 2023 | $6,711 | $34,814 | $10,853 | $23,961 |
| 2022 | $6,270 | $52,140 | $15,600 | $36,540 |
| 2021 | $6,616 | $49,500 | $15,600 | $33,900 |
| 2020 | $6,604 | $50,940 | $15,600 | $35,340 |
| 2019 | $6,140 | $50,040 | $15,600 | $34,440 |
| 2018 | $5,616 | $29,012 | $12,850 | $16,162 |
| 2017 | $5,280 | $27,370 | $11,478 | $15,892 |
| 2016 | $5,162 | $27,370 | $11,478 | $15,892 |
| 2015 | $2,895 | $27,163 | $14,868 | $12,295 |
| 2014 | $2,895 | $25,627 | $16,832 | $8,795 |
Source: Public Records
Map
Nearby Homes