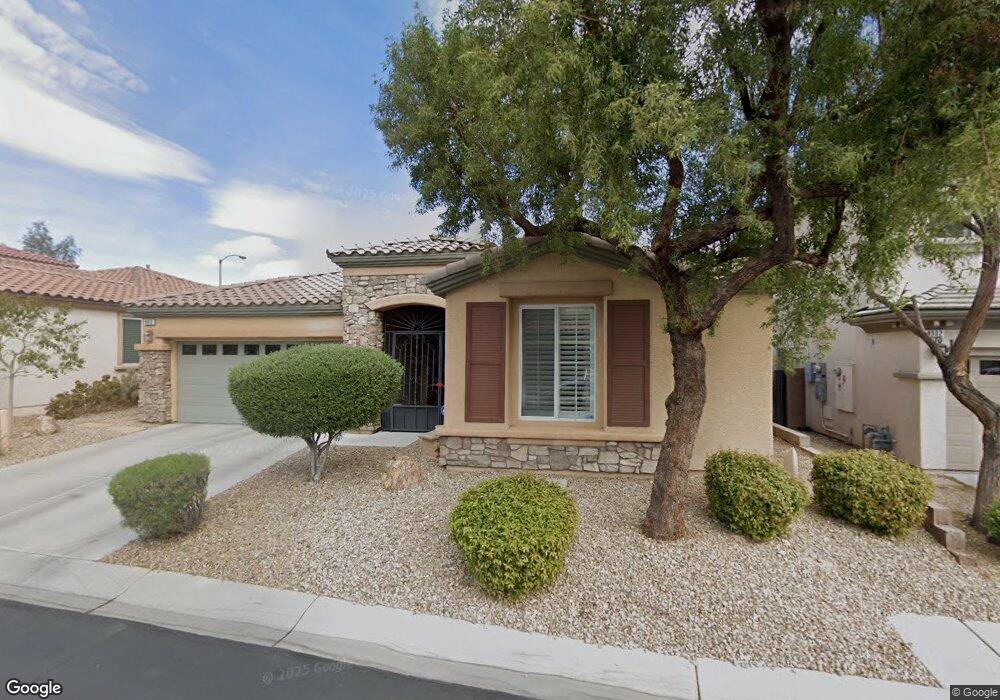
8912 Oceanside Slopes Ave Unit 2 Las Vegas, NV 89178
Mountains Edge NeighborhoodEstimated Value: $519,000 - $530,000
3
Beds
3
Baths
1,911
Sq Ft
$275/Sq Ft
Est. Value
About This Home
This home is located at 8912 Oceanside Slopes Ave Unit 2, Las Vegas, NV 89178 and is currently estimated at $525,771, approximately $275 per square foot. 8912 Oceanside Slopes Ave Unit 2 is a home located in Clark County with nearby schools including William V. Wright Elementary School, Desert Oasis High School, and Doral Academy Cactus.
Ownership History
Date
Name
Owned For
Owner Type
Purchase Details
Closed on
Jul 27, 2020
Sold by
Baldwin Bonnie
Bought by
Baldwin Dayton Chandler and Baldwin Bonnie Ermine
Current Estimated Value
Purchase Details
Closed on
Mar 1, 2012
Sold by
Baldwin Iii Dayton and Baldwin Bonnie
Bought by
Baldwin Bonnie
Purchase Details
Closed on
Oct 27, 2010
Sold by
Fannie Mae
Bought by
Baldwin Iii Dayton and Baldwin Bonnie
Purchase Details
Closed on
Aug 30, 2010
Sold by
Atkins Lisa
Bought by
Fannie Mae and Federal National Mortgage Association
Purchase Details
Closed on
Apr 22, 2008
Sold by
Atkins Roland
Bought by
Atkins Lisa
Home Financials for this Owner
Home Financials are based on the most recent Mortgage that was taken out on this home.
Original Mortgage
$315,000
Interest Rate
6.11%
Mortgage Type
Unknown
Create a Home Valuation Report for This Property
The Home Valuation Report is an in-depth analysis detailing your home's value as well as a comparison with similar homes in the area
Home Values in the Area
Average Home Value in this Area
Purchase History
| Date | Buyer | Sale Price | Title Company |
|---|---|---|---|
| Baldwin Dayton Chandler | -- | None Available | |
| Baldwin Bonnie | $183,000 | None Available | |
| Baldwin Iii Dayton | $183,000 | Stewart Title Las Vegas War | |
| Fannie Mae | $369,028 | Stewart Title Las Vegas War | |
| Atkins Lisa | -- | First American Title Jones | |
| Atkins Lisa | $350,000 | First American Title Jones |
Source: Public Records
Mortgage History
| Date | Status | Borrower | Loan Amount |
|---|---|---|---|
| Previous Owner | Atkins Lisa | $315,000 |
Source: Public Records
Tax History Compared to Growth
Tax History
| Year | Tax Paid | Tax Assessment Tax Assessment Total Assessment is a certain percentage of the fair market value that is determined by local assessors to be the total taxable value of land and additions on the property. | Land | Improvement |
|---|---|---|---|---|
| 2025 | $2,610 | $156,513 | $43,750 | $112,763 |
| 2024 | $2,534 | $156,513 | $43,750 | $112,763 |
| 2023 | $2,534 | $150,994 | $45,500 | $105,494 |
| 2022 | $2,460 | $131,699 | $35,000 | $96,699 |
| 2021 | $2,389 | $123,657 | $32,200 | $91,457 |
| 2020 | $2,316 | $122,911 | $32,550 | $90,361 |
| 2019 | $2,249 | $116,720 | $28,000 | $88,720 |
| 2018 | $2,183 | $108,837 | $23,450 | $85,387 |
| 2017 | $2,995 | $102,126 | $23,450 | $78,676 |
| 2016 | $1,763 | $80,755 | $17,500 | $63,255 |
| 2015 | $1,759 | $66,009 | $13,300 | $52,709 |
| 2014 | $1,708 | $56,491 | $9,800 | $46,691 |
Source: Public Records
Map
Nearby Homes
- 9031 Jumping Jacks Ave
- 8974 English Falls Way
- 9864 Maspalomas St
- 9651 Bouncing Ball St
- 9076 Bridal Creek Ave
- 8719 Mount Mira Loma Ave
- 9856 Chief Sky St
- 9091 Jumping Jacks Ave
- 9659 Toy Soldier St
- 8823 Autumn Teal Ave
- 9806 Emerald Twilight St
- 9571 Dawning Heat St
- 8968 Horizon Hyatt Ave
- 8733 Autumn Teal Ave
- 9466 Marshall Creek St
- 9825 Emerald Twilight St
- 9534 Twister Trace St
- 9141 Castle Valley Ave
- 9539 Iris Flat Ct
- 9927 Ridgemill St
- 8902 Oceanside Slopes Ave
- 8922 Oceanside Slopes Ave
- 8892 Oceanside Slopes Ave
- 8932 Oceanside Slopes Ave
- 8911 Oceanside Slopes Ave
- 8921 Oceanside Slopes Ave
- 8901 Oceanside Slopes Ave Unit N/a
- 8882 Oceanside Slopes Ave
- 8942 Oceanside Slopes Ave
- 8891 Oceanside Slopes Ave
- 8943 Oceanside Slopes Ave
- 9690 Sunset Blaze Ct
- 8872 Oceanside Slopes Ave
- 8952 Oceanside Slopes Ave
- 8881 Oceanside Slopes Ave
- 9689 Salmon Rose Place
- 8953 Oceanside Slopes Ave
- 8871 Oceanside Slopes Ave
- 8864 Oceanside Slopes Ave
- 8962 Oceanside Slopes Ave