Estimated Value: $494,000 - $533,829
3
Beds
2
Baths
2,079
Sq Ft
$250/Sq Ft
Est. Value
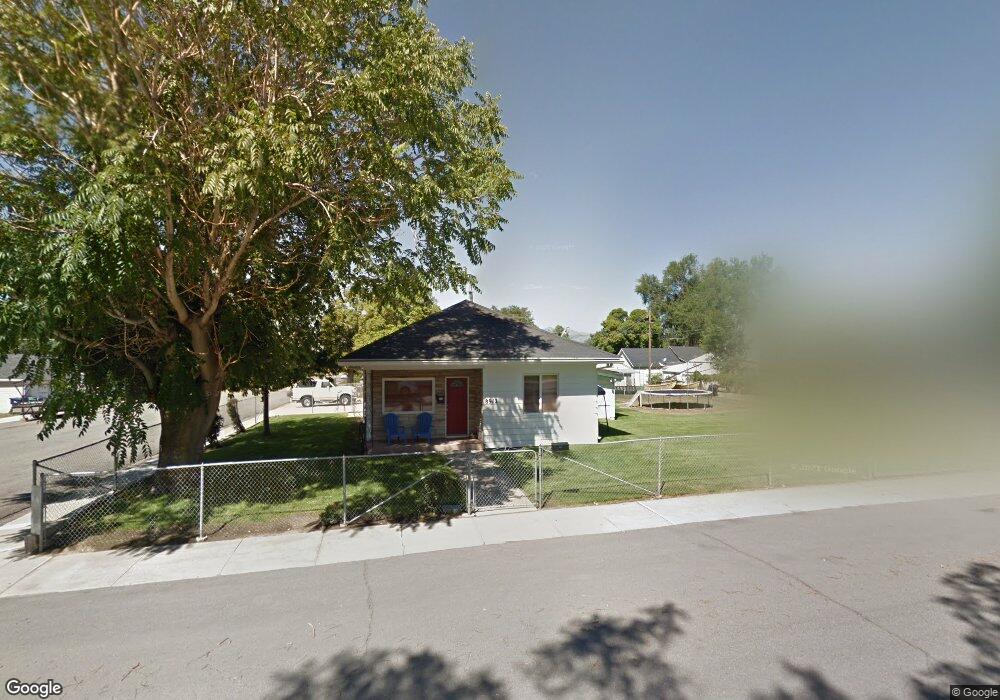
About This Home
This home is located at 8912 S 120 E, Sandy, UT 84070 and is currently estimated at $520,457, approximately $250 per square foot. 8912 S 120 E is a home located in Salt Lake County with nearby schools including Sandy Elementary School, Mount Jordan Middle School, and Jordan High.
Ownership History
Date
Name
Owned For
Owner Type
Purchase Details
Closed on
Jul 20, 2020
Sold by
Mulcahy David P
Bought by
Franco Myrna and Mulcahy David P
Current Estimated Value
Purchase Details
Closed on
Mar 23, 2007
Sold by
Ingersoll Mitchell and Ingersoll Burlene B
Bought by
Mulcahy David P
Home Financials for this Owner
Home Financials are based on the most recent Mortgage that was taken out on this home.
Original Mortgage
$70,320
Outstanding Balance
$42,890
Interest Rate
6.31%
Mortgage Type
Stand Alone Second
Estimated Equity
$477,567
Purchase Details
Closed on
Aug 3, 2006
Sold by
Ingersoll Burlene B
Bought by
Ingersoll Michell and Ingersoll Burlene B
Purchase Details
Closed on
Feb 1, 2002
Sold by
Barton Lindy L
Bought by
Barton Lindy L and Ingersoll Burlene B
Create a Home Valuation Report for This Property
The Home Valuation Report is an in-depth analysis detailing your home's value as well as a comparison with similar homes in the area
Home Values in the Area
Average Home Value in this Area
Purchase History
| Date | Buyer | Sale Price | Title Company |
|---|---|---|---|
| Franco Myrna | -- | None Available | |
| Mulcahy David P | -- | Backman Title Services | |
| Ingersoll Michell | -- | Metro National Title | |
| Barton Lindy L | -- | Metro National Title |
Source: Public Records
Mortgage History
| Date | Status | Borrower | Loan Amount |
|---|---|---|---|
| Open | Mulcahy David P | $70,320 | |
| Open | Mulcahy David P | $164,080 |
Source: Public Records
Tax History
| Year | Tax Paid | Tax Assessment Tax Assessment Total Assessment is a certain percentage of the fair market value that is determined by local assessors to be the total taxable value of land and additions on the property. | Land | Improvement |
|---|---|---|---|---|
| 2025 | $2,452 | $514,500 | $134,500 | $380,000 |
| 2024 | $2,452 | $453,400 | $123,400 | $330,000 |
| 2023 | $2,210 | $407,500 | $117,300 | $290,200 |
| 2022 | $2,363 | $425,700 | $115,000 | $310,700 |
| 2021 | $2,256 | $345,900 | $90,000 | $255,900 |
| 2020 | $2,125 | $307,200 | $90,000 | $217,200 |
| 2019 | $1,949 | $274,700 | $90,000 | $184,700 |
| 2016 | $1,628 | $220,600 | $64,800 | $155,800 |
Source: Public Records
Map
Nearby Homes
- 8558 S Center St
- 112 E 8680 S
- 270 E 8680 S
- 87 W 8710 S
- 412 E 8760 S
- 220 E Pioneer Ave
- 194 Pioneer Ave
- 362 E 9150 S
- 149 E Pioneer Ave
- 87 Pioneer Ave
- 37 Crawford Place
- 140 W 8710 S
- 8812 S Stratford Cir
- 8470 Solar Way
- 227 E St Germain Way
- 8459 S 300 E
- 487 E 9270 S
- 8732 S 620 E
- 359 E 8400 S
- 36 E Opequon Rd
Your Personal Tour Guide
Ask me questions while you tour the home.