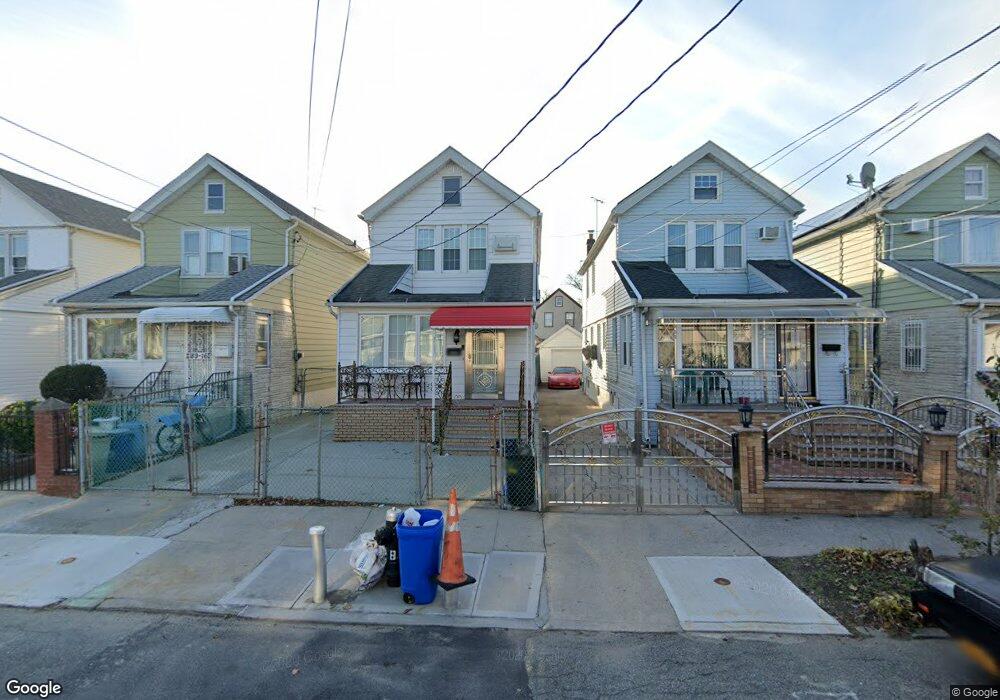
8914 186th St Hollis, NY 11423
Hollis NeighborhoodEstimated Value: $764,000 - $835,948
--
Bed
--
Bath
1,344
Sq Ft
$598/Sq Ft
Est. Value
About This Home
This home is located at 8914 186th St, Hollis, NY 11423 and is currently estimated at $803,987, approximately $598 per square foot. 8914 186th St is a home located in Queens County with nearby schools including P.S. 35 Nathaniel Woodhull, I.S. 238 Susan B Anthony Academy, and Wellspring Elementary & Middle.
Ownership History
Date
Name
Owned For
Owner Type
Purchase Details
Closed on
Jun 6, 2024
Sold by
Rahim Abdul Shackim and Rahim Shameer
Bought by
Rahim Shameer
Current Estimated Value
Purchase Details
Closed on
Apr 26, 2017
Sold by
Rahim Abdul Shackim and Rahim Shameer
Bought by
Rahim Shameer
Purchase Details
Closed on
May 9, 2014
Sold by
Rahim Abdul S and Rahim Inshan S
Bought by
Rahim Abdul S and Rahim Shameer
Home Financials for this Owner
Home Financials are based on the most recent Mortgage that was taken out on this home.
Original Mortgage
$5,264
Interest Rate
4.18%
Mortgage Type
New Conventional
Purchase Details
Closed on
Aug 7, 2001
Sold by
Ade Jerome L R
Bought by
Rahim Abdul Shackim and Rahim Inshan Shackin
Home Financials for this Owner
Home Financials are based on the most recent Mortgage that was taken out on this home.
Original Mortgage
$199,500
Interest Rate
6.99%
Create a Home Valuation Report for This Property
The Home Valuation Report is an in-depth analysis detailing your home's value as well as a comparison with similar homes in the area
Home Values in the Area
Average Home Value in this Area
Purchase History
| Date | Buyer | Sale Price | Title Company |
|---|---|---|---|
| Rahim Shameer | -- | -- | |
| Rahim Shameer | -- | -- | |
| Rahim Shameer | -- | -- | |
| Rahim Abdul S | -- | -- | |
| Rahim Abdul S | -- | -- | |
| Rahim Abdul Shackim | -- | -- | |
| Rahim Abdul Shackim | -- | -- |
Source: Public Records
Mortgage History
| Date | Status | Borrower | Loan Amount |
|---|---|---|---|
| Previous Owner | Rahim Abdul S | $5,264 | |
| Previous Owner | Rahim Abdul Shackim | $199,500 |
Source: Public Records
Tax History Compared to Growth
Tax History
| Year | Tax Paid | Tax Assessment Tax Assessment Total Assessment is a certain percentage of the fair market value that is determined by local assessors to be the total taxable value of land and additions on the property. | Land | Improvement |
|---|---|---|---|---|
| 2025 | $5,997 | $31,536 | $8,601 | $22,935 |
| 2024 | $5,997 | $29,860 | $8,983 | $20,877 |
| 2023 | $5,997 | $29,860 | $9,598 | $20,262 |
| 2022 | $5,894 | $40,260 | $12,960 | $27,300 |
| 2021 | $5,863 | $37,320 | $12,960 | $24,360 |
| 2020 | $5,563 | $33,300 | $12,960 | $20,340 |
| 2019 | $5,205 | $32,280 | $12,960 | $19,320 |
| 2018 | $5,072 | $24,883 | $11,435 | $13,448 |
| 2017 | $4,716 | $24,606 | $12,134 | $12,472 |
| 2016 | $4,331 | $24,606 | $12,134 | $12,472 |
| 2015 | $2,590 | $21,900 | $14,400 | $7,500 |
| 2014 | $2,590 | $20,736 | $12,258 | $8,478 |
Source: Public Records
Map
Nearby Homes
- 8839 186th St
- 88-22 186th St
- 90-19 185th St
- 90-21 185th St
- 8931 184th St
- 8829 184th St
- 90-31 185th St
- 90-62 187th St
- 8746 Chelsea St Unit 6E
- 8746 Chelsea St Unit 7H
- 90-45 186th St
- 187-14 Wexford Terrace
- 182-36 Hillside Ave
- 8918 182nd Place
- 184-09 Jamaica Ave
- 182-34 Hillside Ave
- 8830 182nd St Unit 1E
- 188-09 Jamaica Ave
- 8908 182nd St
- 8830 182nd St Unit 3F