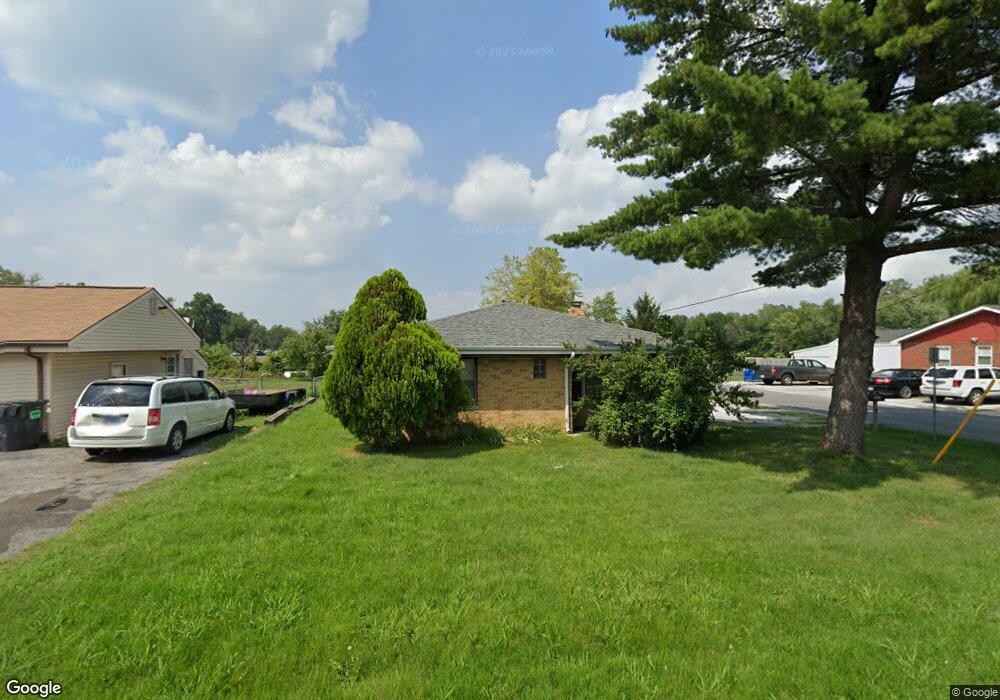
8915 Rene Ave Collinsville, IL 62234
Estimated Value: $101,000 - $162,369
3
Beds
2
Baths
1,900
Sq Ft
$63/Sq Ft
Est. Value
About This Home
This home is located at 8915 Rene Ave, Collinsville, IL 62234 and is currently estimated at $118,842, approximately $62 per square foot. 8915 Rene Ave is a home located in Madison County with nearby schools including Kreitner Elementary School, Dorris Intermediate School, and Collinsville Middle School.
Ownership History
Date
Name
Owned For
Owner Type
Purchase Details
Closed on
Apr 13, 2015
Sold by
Calderon Isidro
Bought by
Galvez Manuel
Current Estimated Value
Purchase Details
Closed on
Mar 31, 2011
Sold by
Calderon Isidro
Bought by
Galvez Manuel
Purchase Details
Closed on
Feb 23, 2011
Sold by
Jolley Susan and Collazo Susan J
Bought by
Calderon Isidro
Purchase Details
Closed on
Nov 5, 2009
Sold by
Collazo Jorge
Bought by
Jolley Susan
Purchase Details
Closed on
Dec 10, 2003
Sold by
Rodawald Byron H
Bought by
Collazo Jorge E and Collazo Susan J
Home Financials for this Owner
Home Financials are based on the most recent Mortgage that was taken out on this home.
Original Mortgage
$22,500
Interest Rate
6.03%
Mortgage Type
Purchase Money Mortgage
Create a Home Valuation Report for This Property
The Home Valuation Report is an in-depth analysis detailing your home's value as well as a comparison with similar homes in the area
Home Values in the Area
Average Home Value in this Area
Purchase History
| Date | Buyer | Sale Price | Title Company |
|---|---|---|---|
| Galvez Manuel | $40,000 | None Available | |
| Galvez Manuel | -- | Abstract & Title Inc | |
| Calderon Isidro | $30,000 | Pontoon Title Co | |
| Jolley Susan | -- | None Available | |
| Collazo Jorge E | $25,000 | Chicago Title |
Source: Public Records
Mortgage History
| Date | Status | Borrower | Loan Amount |
|---|---|---|---|
| Previous Owner | Collazo Jorge E | $22,500 |
Source: Public Records
Tax History Compared to Growth
Tax History
| Year | Tax Paid | Tax Assessment Tax Assessment Total Assessment is a certain percentage of the fair market value that is determined by local assessors to be the total taxable value of land and additions on the property. | Land | Improvement |
|---|---|---|---|---|
| 2024 | $1,730 | $30,980 | $1,940 | $29,040 |
| 2023 | $1,730 | $26,980 | $1,690 | $25,290 |
| 2022 | $1,522 | $24,480 | $1,530 | $22,950 |
| 2021 | $1,315 | $23,270 | $1,450 | $21,820 |
| 2020 | $1,270 | $22,510 | $1,400 | $21,110 |
| 2019 | $1,235 | $21,850 | $1,350 | $20,500 |
| 2018 | $1,199 | $20,600 | $1,270 | $19,330 |
| 2017 | $1,124 | $20,600 | $1,270 | $19,330 |
| 2016 | $1,196 | $20,600 | $1,270 | $19,330 |
| 2015 | $1,228 | $20,670 | $1,280 | $19,390 |
| 2014 | $1,228 | $20,670 | $1,280 | $19,390 |
| 2013 | $1,228 | $21,250 | $1,320 | $19,930 |
Source: Public Records
Map
Nearby Homes
- 408 Hillside Dr
- 45 Bellevue Dr
- 1735 Cherokee St
- 24 W Reynolds St
- 101 Osage Dr
- 504 S 5th St
- 625 Greenwood Place
- 717 Greenwood Place
- 602 S 5th St
- 397 Nicole Dr
- 298 Nicole Dr
- 312 E Ofallon Dr
- 286 Nicole Dr
- 282 Nicole Dr
- 11 Davis Place
- 274 Nicole Dr
- 270 Nicole Dr
- 806 Erika Leigh Ct
- 406 Cypress Creek Rd
- 101 Westminster Dr