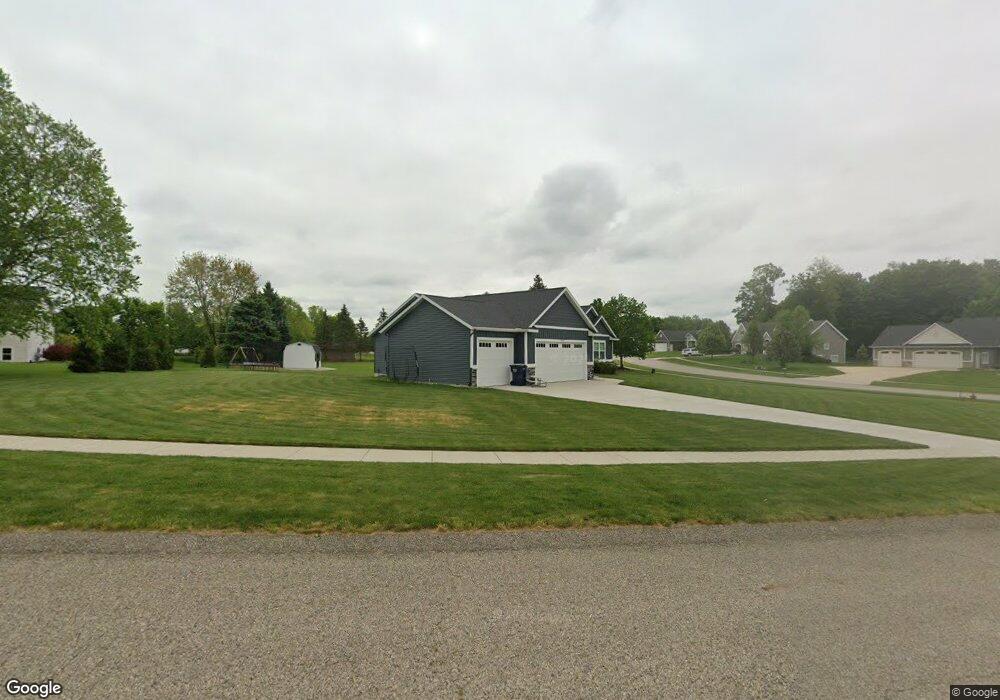
8916 Southridge Ct SW Byron Center, MI 49315
Estimated Value: $536,200 - $608,000
--
Bed
--
Bath
29,185
Sq Ft
$20/Sq Ft
Est. Value
About This Home
This home is located at 8916 Southridge Ct SW, Byron Center, MI 49315 and is currently estimated at $576,800, approximately $19 per square foot. 8916 Southridge Ct SW is a home located in Kent County with nearby schools including Robert L. Nickels Intermediate School, Brown Elementary School, and Byron Center West Middle School.
Ownership History
Date
Name
Owned For
Owner Type
Purchase Details
Closed on
Aug 25, 2022
Sold by
Brenner Travis J and Brenner Andrea E
Bought by
Travis And Andrea Brenner Trust
Current Estimated Value
Purchase Details
Closed on
Aug 3, 2020
Sold by
John W Wierenga Ii Revocable Living Trus
Bought by
Brenner Andrea E and Brenner Travis J
Home Financials for this Owner
Home Financials are based on the most recent Mortgage that was taken out on this home.
Original Mortgage
$361,000
Interest Rate
3.1%
Mortgage Type
New Conventional
Purchase Details
Closed on
Jul 30, 2020
Sold by
Wierenga John W
Bought by
Brenner Rennerjohn W and Brenner Andrea E
Home Financials for this Owner
Home Financials are based on the most recent Mortgage that was taken out on this home.
Original Mortgage
$361,000
Interest Rate
3.1%
Mortgage Type
New Conventional
Create a Home Valuation Report for This Property
The Home Valuation Report is an in-depth analysis detailing your home's value as well as a comparison with similar homes in the area
Home Values in the Area
Average Home Value in this Area
Purchase History
| Date | Buyer | Sale Price | Title Company |
|---|---|---|---|
| Travis And Andrea Brenner Trust | -- | -- | |
| Brenner Andrea E | -- | Sun Title | |
| Brenner Rennerjohn W | $96,000 | Sun Title Agency Of Michigan |
Source: Public Records
Mortgage History
| Date | Status | Borrower | Loan Amount |
|---|---|---|---|
| Previous Owner | Brenner Andrea E | $361,000 | |
| Previous Owner | Brenner Rennerjohn W | $361,000 |
Source: Public Records
Tax History Compared to Growth
Tax History
| Year | Tax Paid | Tax Assessment Tax Assessment Total Assessment is a certain percentage of the fair market value that is determined by local assessors to be the total taxable value of land and additions on the property. | Land | Improvement |
|---|---|---|---|---|
| 2025 | $4,692 | $263,600 | $0 | $0 |
| 2024 | $4,692 | $251,700 | $0 | $0 |
| 2023 | $4,487 | $225,800 | $0 | $0 |
| 2022 | $6,163 | $209,300 | $0 | $0 |
| 2021 | $5,999 | $194,500 | $0 | $0 |
| 2020 | $575 | $28,300 | $0 | $0 |
| 2019 | $815 | $26,900 | $0 | $0 |
| 2018 | $799 | $25,600 | $25,600 | $0 |
| 2017 | $780 | $25,600 | $0 | $0 |
| 2016 | $752 | $25,000 | $0 | $0 |
| 2015 | $739 | $25,000 | $0 | $0 |
| 2013 | -- | $24,500 | $0 | $0 |
Source: Public Records
Map
Nearby Homes
- 2599 Ridge Top Dr SW
- 8750 Lindsey Ln SW Unit 23
- 2267 Aimie Ave SW
- 2156 Center Grange Dr
- 8581 Troy St SW
- 8541 Woodhaven Dr SW
- 8564 Elkwood Dr SW
- 670 84th St SW
- 1861 Restoration Dr SW
- 8549 Eldora Dr SW
- 8608 Woodruff Dr SW
- 8330 Rockledge Way SW Unit 92
- 1941 Conifer Ridge Dr SW
- 8695 Bethany Dr SW
- 8652 Bethany Dr SW
- 8638 Bethany Dr SW
- 2740 Woodhaven Ct SW Unit 2
- 8393 Woodhaven Dr SW Unit 1
- 1768 Hightree Dr SW
- 3152 84th St SW
- 8916 Southridge Ct SW
- 9000 Conifer Ridge Dr SW
- 8902 Southridge Ct SW
- 8950 Conifer Ridge Dr SW
- 8985 Conifer Ridge Dr SW
- 8893 S Ridge Ct SW
- 9020 Conifer Ridge Dr SW
- 8905 Southridge Ct SW
- 8893 Southridge Ct SW
- 8969 Conifer Ridge Dr SW
- 9011 Conifer Ridge Dr SW
- 8890 Southridge Ct SW
- 8936 Conifer Ridge Dr SW
- 9025 Conifer Ridge Dr SW
- 2548 Southplatte Dr SW
- 2552 Southplatte Dr SW
- 2536 Southplatte Dr SW
- 8947 Conifer Ridge Dr SW
- 2524 Southplatte Dr SW
- 2590 Southplatte Dr SW