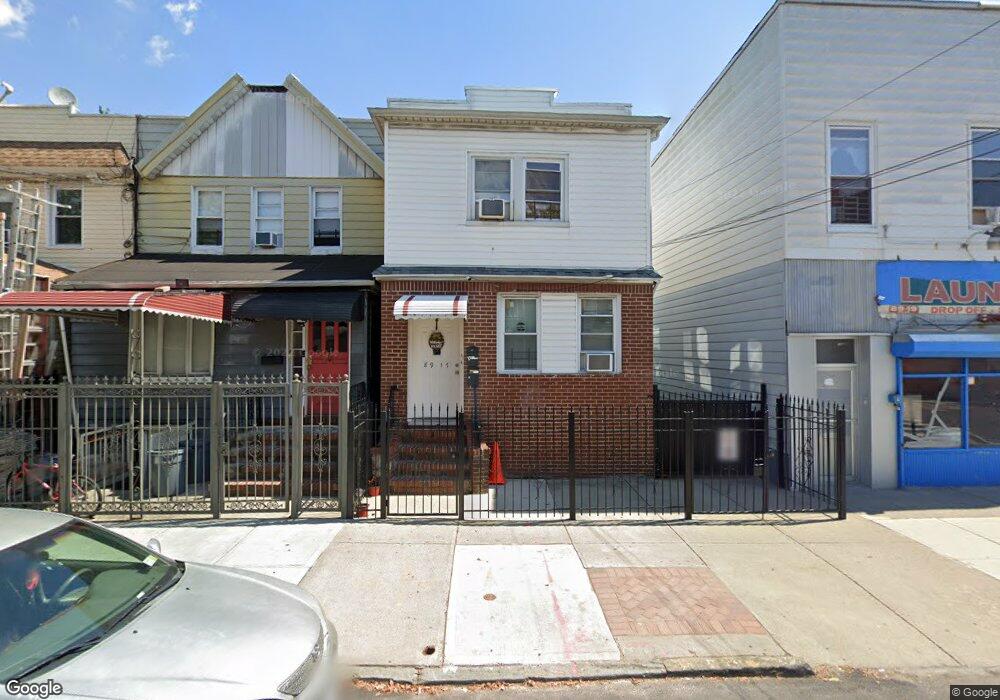
8917 80th St Woodhaven, NY 11421
Woodhaven NeighborhoodEstimated Value: $838,597 - $977,000
--
Bed
--
Bath
2,016
Sq Ft
$460/Sq Ft
Est. Value
About This Home
This home is located at 8917 80th St, Woodhaven, NY 11421 and is currently estimated at $926,399, approximately $459 per square foot. 8917 80th St is a home located in Queens County with nearby schools including P.S. 060 Woodhaven, Santiam Elementary School, and Alice Ott Middle School.
Ownership History
Date
Name
Owned For
Owner Type
Purchase Details
Closed on
Apr 19, 2004
Sold by
Rubio Elsa and Rubio Jaime
Bought by
Caba Pedro
Current Estimated Value
Home Financials for this Owner
Home Financials are based on the most recent Mortgage that was taken out on this home.
Original Mortgage
$403,750
Interest Rate
5.36%
Mortgage Type
Purchase Money Mortgage
Purchase Details
Closed on
Sep 22, 1999
Sold by
Criscuola Joseph A and Criscuola Doris
Bought by
Rubio Jaime
Home Financials for this Owner
Home Financials are based on the most recent Mortgage that was taken out on this home.
Original Mortgage
$273,160
Interest Rate
7.81%
Mortgage Type
FHA
Create a Home Valuation Report for This Property
The Home Valuation Report is an in-depth analysis detailing your home's value as well as a comparison with similar homes in the area
Home Values in the Area
Average Home Value in this Area
Purchase History
| Date | Buyer | Sale Price | Title Company |
|---|---|---|---|
| Caba Pedro | $425,000 | -- | |
| Rubio Jaime | $283,000 | Fidelity National Title Ins |
Source: Public Records
Mortgage History
| Date | Status | Borrower | Loan Amount |
|---|---|---|---|
| Previous Owner | Caba Pedro | $403,750 | |
| Previous Owner | Rubio Jaime | $273,160 |
Source: Public Records
Tax History Compared to Growth
Tax History
| Year | Tax Paid | Tax Assessment Tax Assessment Total Assessment is a certain percentage of the fair market value that is determined by local assessors to be the total taxable value of land and additions on the property. | Land | Improvement |
|---|---|---|---|---|
| 2025 | $7,131 | $39,115 | $12,049 | $27,066 |
| 2024 | $7,143 | $36,902 | $13,613 | $23,289 |
| 2023 | $6,711 | $34,814 | $11,414 | $23,400 |
| 2022 | $6,270 | $47,640 | $16,800 | $30,840 |
| 2021 | $6,616 | $50,940 | $16,800 | $34,140 |
| 2020 | $6,604 | $49,620 | $16,800 | $32,820 |
| 2019 | $6,140 | $47,340 | $16,800 | $30,540 |
| 2018 | $5,616 | $29,012 | $11,773 | $17,239 |
| 2017 | $5,280 | $27,370 | $15,236 | $12,134 |
| 2016 | $5,162 | $27,370 | $15,236 | $12,134 |
| 2015 | $2,895 | $27,163 | $16,435 | $10,728 |
| 2014 | $2,895 | $25,627 | $15,876 | $9,751 |
Source: Public Records
Map
Nearby Homes