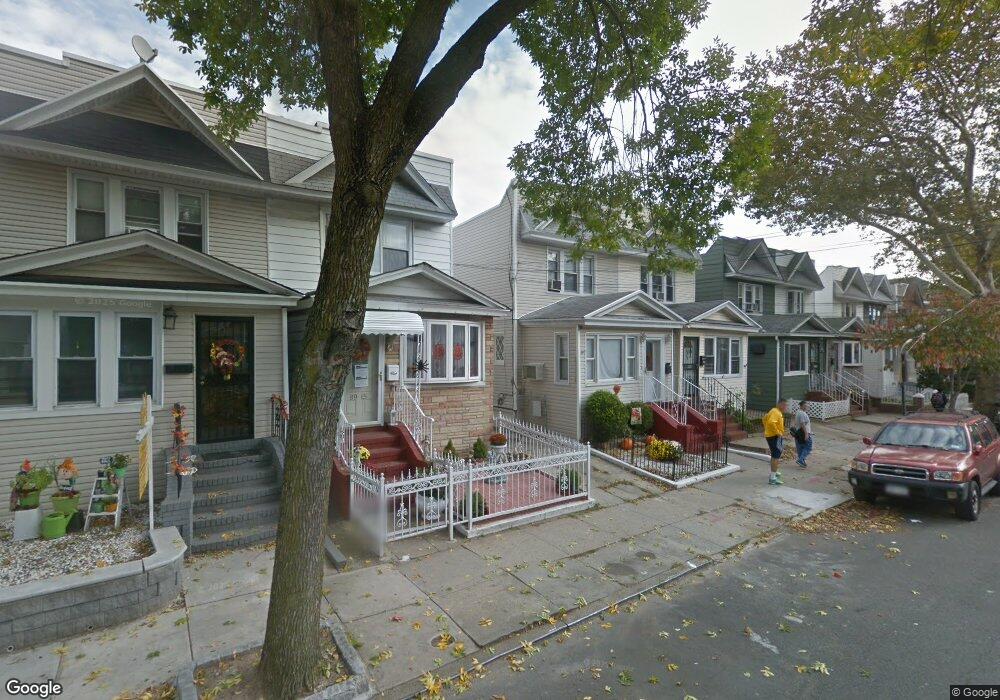
8917 85th St Woodhaven, NY 11421
Woodhaven NeighborhoodEstimated Value: $628,000 - $734,000
Studio
--
Bath
1,344
Sq Ft
$510/Sq Ft
Est. Value
About This Home
This home is located at 8917 85th St, Woodhaven, NY 11421 and is currently estimated at $685,409, approximately $509 per square foot. 8917 85th St is a home located in Queens County with nearby schools including P.S. 060 Woodhaven, Jhs 210 Elizabeth Blackwell, and St. Thomas the Apostle Catholic Academy.
Ownership History
Date
Name
Owned For
Owner Type
Purchase Details
Closed on
Oct 28, 2004
Sold by
Dejesus Rosa and Ortega Claudi
Bought by
Ortega Claudia and Ortega Juan
Current Estimated Value
Purchase Details
Closed on
Jul 7, 2003
Sold by
Castro and Marlen L
Bought by
Dejesus Rosa and Ortega Claudia
Home Financials for this Owner
Home Financials are based on the most recent Mortgage that was taken out on this home.
Original Mortgage
$288,658
Interest Rate
6.29%
Mortgage Type
Purchase Money Mortgage
Purchase Details
Closed on
Oct 16, 2000
Sold by
Woehr Mary T and Fahy Thomas E
Bought by
Drawert Marlen and Zuniga Jose A
Home Financials for this Owner
Home Financials are based on the most recent Mortgage that was taken out on this home.
Original Mortgage
$184,561
Interest Rate
7.64%
Mortgage Type
FHA
Purchase Details
Closed on
May 17, 2000
Sold by
Fahy Thomas E and Fahy Mary T
Bought by
Woehr Mary T and Fahy Thomas E
Create a Home Valuation Report for This Property
The Home Valuation Report is an in-depth analysis detailing your home's value as well as a comparison with similar homes in the area
Home Values in the Area
Average Home Value in this Area
Purchase History
| Date | Buyer | Sale Price | Title Company |
|---|---|---|---|
| Ortega Claudia | -- | -- | |
| Ortega Claudia | -- | -- | |
| Dejesus Rosa | $303,852 | -- | |
| Dejesus Rosa | $303,852 | -- | |
| Drawert Marlen | $190,000 | -- | |
| Drawert Marlen | $190,000 | -- | |
| Woehr Mary T | -- | Chicago Title Co | |
| Woehr Mary T | -- | Chicago Title Co |
Source: Public Records
Mortgage History
| Date | Status | Borrower | Loan Amount |
|---|---|---|---|
| Previous Owner | Dejesus Rosa | $288,658 | |
| Previous Owner | Drawert Marlen | $184,561 | |
| Closed | Ortega Claudia | $0 |
Source: Public Records
Tax History
| Year | Tax Paid | Tax Assessment Tax Assessment Total Assessment is a certain percentage of the fair market value that is determined by local assessors to be the total taxable value of land and additions on the property. | Land | Improvement |
|---|---|---|---|---|
| 2025 | $5,324 | $29,580 | $8,403 | $21,177 |
| 2024 | $5,336 | $27,907 | $8,855 | $19,052 |
| 2023 | $5,324 | $27,907 | $8,138 | $19,769 |
| 2022 | $5,120 | $37,200 | $11,880 | $25,320 |
| 2021 | $5,203 | $36,120 | $11,880 | $24,240 |
| 2020 | $4,922 | $33,720 | $11,880 | $21,840 |
| 2019 | $4,572 | $34,620 | $11,880 | $22,740 |
| 2018 | $4,443 | $23,256 | $9,573 | $13,683 |
| 2017 | $4,302 | $22,572 | $9,409 | $13,163 |
| 2016 | $4,043 | $22,572 | $9,409 | $13,163 |
| 2015 | $2,349 | $20,542 | $11,647 | $8,895 |
| 2014 | $2,349 | $19,380 | $13,200 | $6,180 |
Source: Public Records
Map
Nearby Homes
Your Personal Tour Guide
Ask me questions while you tour the home.