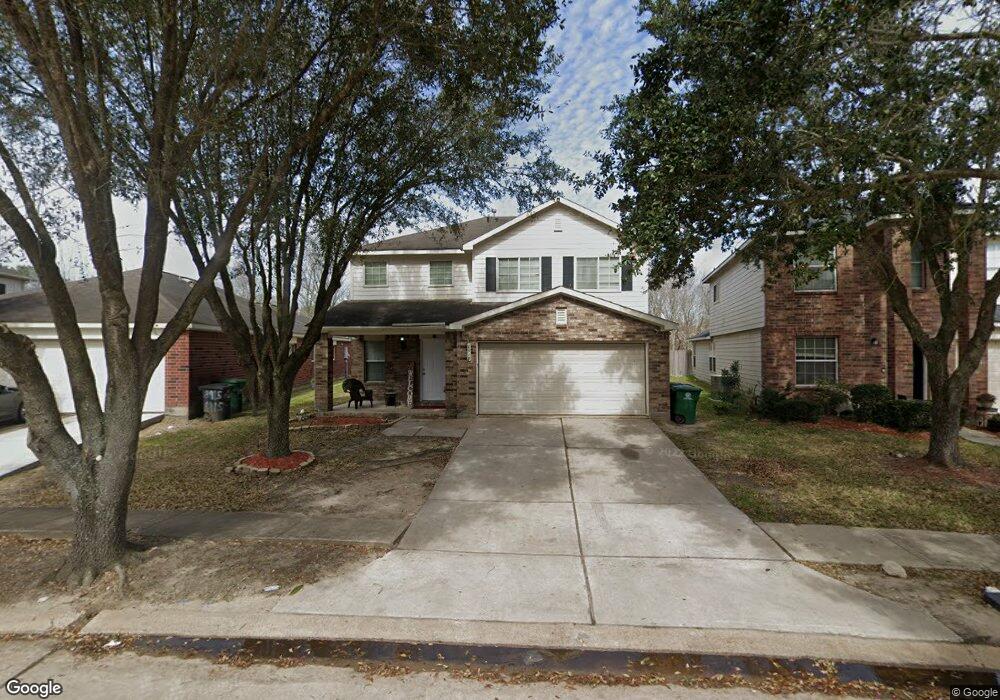
8919 Danbury Hollow Ln Houston, TX 77075
Southbelt-Ellington NeighborhoodEstimated Value: $264,741 - $290,000
3
Beds
3
Baths
2,039
Sq Ft
$137/Sq Ft
Est. Value
About This Home
This home is located at 8919 Danbury Hollow Ln, Houston, TX 77075 and is currently estimated at $279,935, approximately $137 per square foot. 8919 Danbury Hollow Ln is a home located in Harris County with nearby schools including Laura Welch Bush Elementary School, Morris Middle School, and Beverly Hill Intermediate School.
Ownership History
Date
Name
Owned For
Owner Type
Purchase Details
Closed on
Jan 18, 2011
Sold by
Gutierrez Santos
Bought by
Garza Eloy
Current Estimated Value
Home Financials for this Owner
Home Financials are based on the most recent Mortgage that was taken out on this home.
Original Mortgage
$112,084
Outstanding Balance
$76,743
Interest Rate
4.87%
Mortgage Type
FHA
Estimated Equity
$203,192
Purchase Details
Closed on
Oct 26, 2006
Sold by
Guerrero Cynthia
Bought by
Gutierrez Santos
Home Financials for this Owner
Home Financials are based on the most recent Mortgage that was taken out on this home.
Original Mortgage
$131,400
Interest Rate
9.91%
Mortgage Type
Purchase Money Mortgage
Purchase Details
Closed on
Sep 22, 2004
Sold by
Centex Homes
Bought by
Guerrero Cynthia
Home Financials for this Owner
Home Financials are based on the most recent Mortgage that was taken out on this home.
Original Mortgage
$127,764
Interest Rate
5.81%
Mortgage Type
FHA
Create a Home Valuation Report for This Property
The Home Valuation Report is an in-depth analysis detailing your home's value as well as a comparison with similar homes in the area
Home Values in the Area
Average Home Value in this Area
Purchase History
| Date | Buyer | Sale Price | Title Company |
|---|---|---|---|
| Garza Eloy | -- | Etc | |
| Gutierrez Santos | -- | Alamo Title Company | |
| Guerrero Cynthia | -- | Commerce Title Co |
Source: Public Records
Mortgage History
| Date | Status | Borrower | Loan Amount |
|---|---|---|---|
| Open | Garza Eloy | $112,084 | |
| Previous Owner | Gutierrez Santos | $131,400 | |
| Previous Owner | Guerrero Cynthia | $127,764 |
Source: Public Records
Tax History Compared to Growth
Tax History
| Year | Tax Paid | Tax Assessment Tax Assessment Total Assessment is a certain percentage of the fair market value that is determined by local assessors to be the total taxable value of land and additions on the property. | Land | Improvement |
|---|---|---|---|---|
| 2025 | $7,495 | $247,345 | $41,211 | $206,134 |
| 2024 | $7,495 | $258,621 | $41,211 | $217,410 |
| 2023 | $7,495 | $258,621 | $41,211 | $217,410 |
| 2022 | $7,151 | $238,377 | $41,211 | $197,166 |
| 2021 | $6,229 | $197,344 | $36,362 | $160,982 |
| 2020 | $6,141 | $187,734 | $36,362 | $151,372 |
| 2019 | $6,149 | $179,135 | $36,362 | $142,773 |
| 2018 | $2,269 | $161,780 | $30,710 | $131,070 |
| 2017 | $5,218 | $156,519 | $30,710 | $125,809 |
| 2016 | $5,034 | $150,995 | $28,151 | $122,844 |
| 2015 | $4,508 | $139,498 | $25,592 | $113,906 |
| 2014 | $4,508 | $129,804 | $25,592 | $104,212 |
Source: Public Records
Map
Nearby Homes
- 10307 Collin Park
- 10223 Belcamp Ct
- 8706 Danbury Hollow Ln
- 10406 Sutter Glen Ln
- 8614 Viera Ln
- 10218 Carmencita Way
- 00 Fuqua St
- 10506 Pleasant Villas Ln
- 10518 Tenleyton Ln
- 9307 Fuqua Ridge Ln
- 0 Fuqua St Unit 64883593
- 0 Fuqua St Unit 45902141
- 0 Fuqua St Unit 97219329
- 9319 Canady Park Ln
- 7329 Madison Commons Ln
- 7322 Madison Commons Ln
- 9825 Radio Rd
- 001 Fuqua St
- 9238 Quercus Cir
- 8612 Fuqua St
- 8915 Danbury Hollow Ln
- 8923 Danbury Hollow Ln
- 8911 Danbury Hollow Ln
- 10214 Chickfield Ct
- 10210 Chickfield Ct
- 8907 Danbury Hollow Ln
- 8914 Danbury Hollow Ln
- 8918 Danbury Hollow Ln
- 10206 Chickfield Ct
- 8910 Danbury Hollow Ln
- 8903 Danbury Hollow Ln
- 8922 Danbury Hollow Ln
- 8906 Danbury Hollow Ln
- 8839 Danbury Hollow Ln
- 8902 Danbury Hollow Ln
- 10202 Kinsdale Crossing Ln
- 10202 Kingsdale Crossing Ln
- 10202 Chickfield Ct
- 8835 Danbury Hollow Ln
- 8911 Rainesville Ln