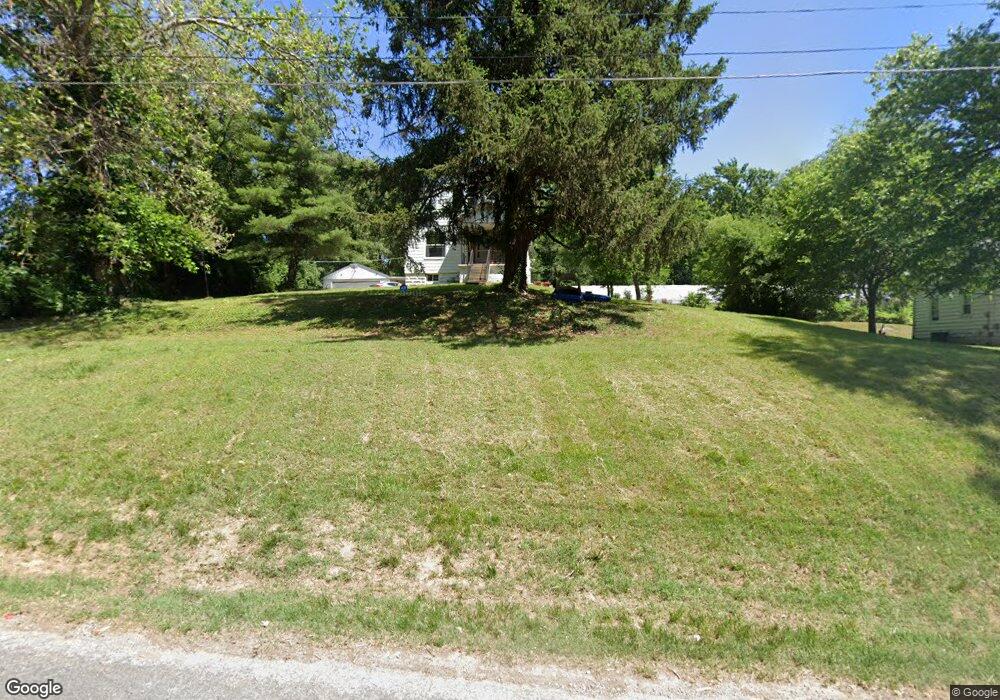
8919 Pleasant View Dr Fairview Heights, IL 62208
Estimated Value: $68,000 - $101,000
2
Beds
1
Bath
1,152
Sq Ft
$74/Sq Ft
Est. Value
About This Home
This home is located at 8919 Pleasant View Dr, Fairview Heights, IL 62208 and is currently estimated at $85,552, approximately $74 per square foot. 8919 Pleasant View Dr is a home located in St. Clair County with nearby schools including Mason/Clark Middle School, James Avant Elementary School, and East St Louis Senior High School.
Ownership History
Date
Name
Owned For
Owner Type
Purchase Details
Closed on
Jan 13, 2012
Sold by
The Secretary Of Housing & Urban Develop
Bought by
Rogers Elvie
Current Estimated Value
Purchase Details
Closed on
Oct 31, 2011
Sold by
Robinson Lenore A
Bought by
The Secretary Of Housing & Urban Develop
Purchase Details
Closed on
Nov 21, 2005
Sold by
Beets Roger
Bought by
Robinson Robert and Robinson Lenore
Home Financials for this Owner
Home Financials are based on the most recent Mortgage that was taken out on this home.
Original Mortgage
$56,494
Interest Rate
6.04%
Mortgage Type
FHA
Purchase Details
Closed on
Mar 18, 2005
Sold by
Navickas Waltraut
Bought by
Beets Roger
Home Financials for this Owner
Home Financials are based on the most recent Mortgage that was taken out on this home.
Original Mortgage
$39,000
Interest Rate
6.15%
Mortgage Type
Purchase Money Mortgage
Create a Home Valuation Report for This Property
The Home Valuation Report is an in-depth analysis detailing your home's value as well as a comparison with similar homes in the area
Home Values in the Area
Average Home Value in this Area
Purchase History
| Date | Buyer | Sale Price | Title Company |
|---|---|---|---|
| Rogers Elvie | -- | Lakeside Title & Escrow Agen | |
| The Secretary Of Housing & Urban Develop | -- | None Available | |
| Robinson Robert | $57,000 | Fatic | |
| Beets Roger | $39,000 | Fatic |
Source: Public Records
Mortgage History
| Date | Status | Borrower | Loan Amount |
|---|---|---|---|
| Previous Owner | Robinson Robert | $56,494 | |
| Previous Owner | Beets Roger | $39,000 |
Source: Public Records
Tax History Compared to Growth
Tax History
| Year | Tax Paid | Tax Assessment Tax Assessment Total Assessment is a certain percentage of the fair market value that is determined by local assessors to be the total taxable value of land and additions on the property. | Land | Improvement |
|---|---|---|---|---|
| 2024 | $2,386 | $25,512 | $4,979 | $20,533 |
| 2023 | $2,380 | $24,863 | $4,852 | $20,011 |
| 2022 | $2,085 | $22,848 | $4,459 | $18,389 |
| 2021 | $1,816 | $20,336 | $4,443 | $15,893 |
| 2020 | $1,866 | $20,442 | $4,466 | $15,976 |
| 2019 | $2,054 | $20,442 | $4,466 | $15,976 |
| 2018 | $2,193 | $20,752 | $4,534 | $16,218 |
| 2017 | $2,262 | $20,917 | $6,019 | $14,898 |
| 2016 | $2,250 | $21,049 | $6,057 | $14,992 |
| 2014 | $2,250 | $21,049 | $6,057 | $14,992 |
| 2013 | $1,963 | $25,497 | $11,292 | $14,205 |
Source: Public Records
Map
Nearby Homes
- 1428 1st Ave
- 1619 Pontiac Rd
- 23 Enterprise Rd
- 22 Kassing Dr
- 839 N 82nd St
- 6 Hilltop Place
- 212 Woodcrest Dr
- 9058 Crest Dr
- 2510 N 89th St
- 9515 Holy Cross Rd
- 9021 Crest Dr
- 9019 Crest Dr
- 9017 Crest Dr
- 546 N 81st St
- 11 Weslake Dr
- 9157 Basswood Dr
- 9153 Basswood Dr
- 9149 Basswood Dr
- 9134 Basswood Dr
- 38 Granvue Dr
- 8923 Pleasant View Dr
- 8917 Pleasant View Dr
- 8925 Pleasant View Dr
- 8920 Pleasant View Dr
- 8927 Pleasant View Dr
- 8913 Pleasant View Dr
- 8916 Pleasant View Dr
- 1437 Magdalena Ave
- 1435 Magdalena Ave
- 8929 Pleasant View Dr
- 8912 Pleasant View Dr
- 8911 Pleasant View Dr
- 1433 Magdalena Ave
- 1509 Pleasant View Dr
- 1513 Pleasant View Dr
- 1431 Magdalena Ave
- 8908 Pleasant View Dr
- 1515 Pleasant View Dr
- 1443 1st Ave
- 1439 First