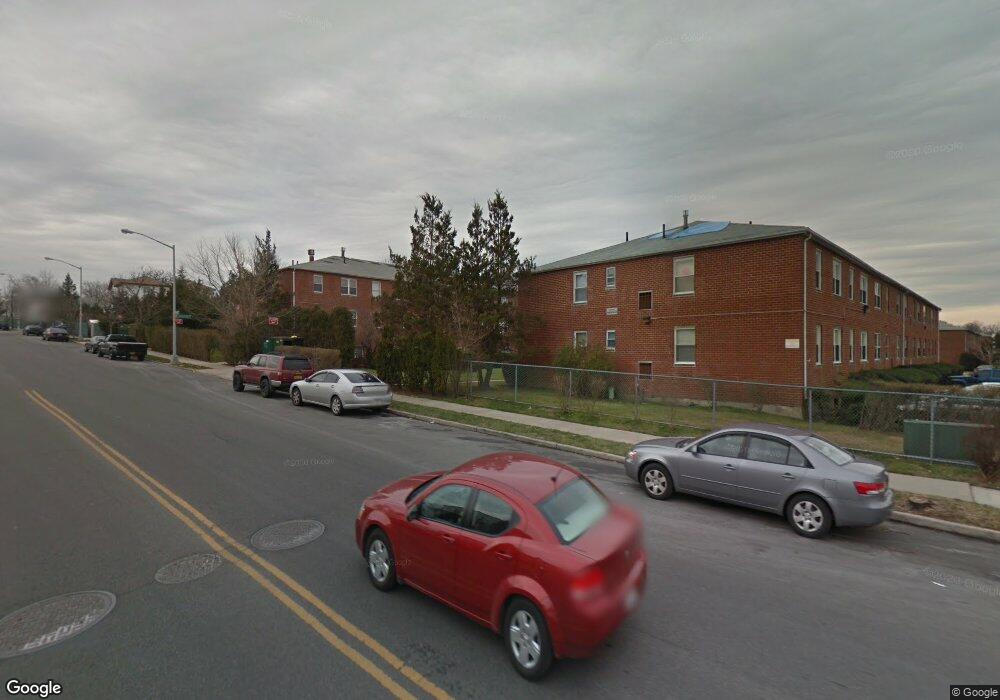
892 Armstrong Ave Unit 2-1 Staten Island, NY 10308
Eltingville NeighborhoodEstimated Value: $288,183 - $320,000
1
Bed
1
Bath
717
Sq Ft
$427/Sq Ft
Est. Value
About This Home
This home is located at 892 Armstrong Ave Unit 2-1, Staten Island, NY 10308 and is currently estimated at $306,046, approximately $426 per square foot. 892 Armstrong Ave Unit 2-1 is a home located in Richmond County with nearby schools including P.S. 32 The Gifford School, I.S. 075 Frank D. Paulo, and Susan E Wagner High School.
Ownership History
Date
Name
Owned For
Owner Type
Purchase Details
Closed on
Dec 4, 2017
Sold by
Donnell Gregory O and Knapp Jessica L
Bought by
Lohse Robert A
Current Estimated Value
Home Financials for this Owner
Home Financials are based on the most recent Mortgage that was taken out on this home.
Original Mortgage
$172,000
Outstanding Balance
$144,809
Interest Rate
3.94%
Mortgage Type
New Conventional
Estimated Equity
$161,237
Purchase Details
Closed on
Jul 24, 2009
Sold by
Cheng Man Chong
Bought by
Odonnell Gregory and Knapp Jessica L
Home Financials for this Owner
Home Financials are based on the most recent Mortgage that was taken out on this home.
Original Mortgage
$198,921
Interest Rate
5.36%
Mortgage Type
FHA
Create a Home Valuation Report for This Property
The Home Valuation Report is an in-depth analysis detailing your home's value as well as a comparison with similar homes in the area
Home Values in the Area
Average Home Value in this Area
Purchase History
| Date | Buyer | Sale Price | Title Company |
|---|---|---|---|
| Lohse Robert A | $215,000 | None Available | |
| Odonnell Gregory | $210,000 | None Available |
Source: Public Records
Mortgage History
| Date | Status | Borrower | Loan Amount |
|---|---|---|---|
| Open | Lohse Robert A | $172,000 | |
| Previous Owner | Odonnell Gregory | $198,921 |
Source: Public Records
Tax History Compared to Growth
Tax History
| Year | Tax Paid | Tax Assessment Tax Assessment Total Assessment is a certain percentage of the fair market value that is determined by local assessors to be the total taxable value of land and additions on the property. | Land | Improvement |
|---|---|---|---|---|
| 2025 | $3,205 | $27,636 | $2,760 | $24,876 |
| 2024 | $2,304 | $26,884 | $2,760 | $24,124 |
| 2023 | $2,231 | $25,296 | $2,760 | $22,536 |
| 2022 | $2,220 | $26,530 | $2,760 | $23,770 |
| 2021 | $2,796 | $22,793 | $2,760 | $20,033 |
| 2020 | $2,185 | $25,347 | $2,760 | $22,587 |
| 2019 | $2,160 | $25,179 | $2,760 | $22,419 |
| 2018 | $2,683 | $26,365 | $2,761 | $23,604 |
| 2017 | $2,362 | $23,286 | $2,761 | $20,525 |
| 2016 | $2,161 | $21,668 | $2,760 | $18,908 |
| 2015 | -- | $17,243 | $2,761 | $14,482 |
| 2014 | -- | $16,954 | $2,761 | $14,193 |
Source: Public Records
Map
Nearby Homes
- 510 Leverett Ave
- 147 Cortelyou Ave Unit 2-3
- 919 Armstrong Ave
- 538 Leverett Ave
- 57 Middle Loop Rd
- 41 Middle Loop Rd
- 360 Barlow Ave Unit 32
- 360 Barlow Ave Unit 12
- 37 E Stroud Ave
- 969 Armstrong Ave
- 88 Cortelyou Ave
- 248 Abingdon Ave
- 74 E Brandis Ave
- 339 Abingdon Ave
- 234 Brookfield Ave
- 0 Getz Ave
- 254 Ridgewood Ave
- 423 Eltingville Blvd
- 223 Abingdon Ave
- 96 Genesee Ave
- 892 Armstrong Ave Unit 2-4
- 892 Armstrong Ave Unit 2-2
- 892 Armstrong Ave Unit 1-4
- 892 Armstrong Ave Unit 1-3
- 892 Armstrong Ave Unit 1-2
- 892 Armstrong Ave Unit 1-1
- 892 Armstrong Ave Unit B3
- 892 Armstrong Ave Unit B2
- 892 Armstrong Ave Unit B1
- 892 Armstrong Ave Unit 23
- 892 Armstrong Ave
- 894 Armstrong Ave Unit 2-4
- 894 Armstrong Ave Unit 2-3
- 894 Armstrong Ave Unit 2-1
- 894 Armstrong Ave Unit 1-4
- 894 Armstrong Ave Unit 1-3
- 894 Armstrong Ave Unit 1-2
- 894 Armstrong Ave Unit 1-1
- 894 Armstrong Ave Unit B3
- 894 Armstrong Ave Unit B2