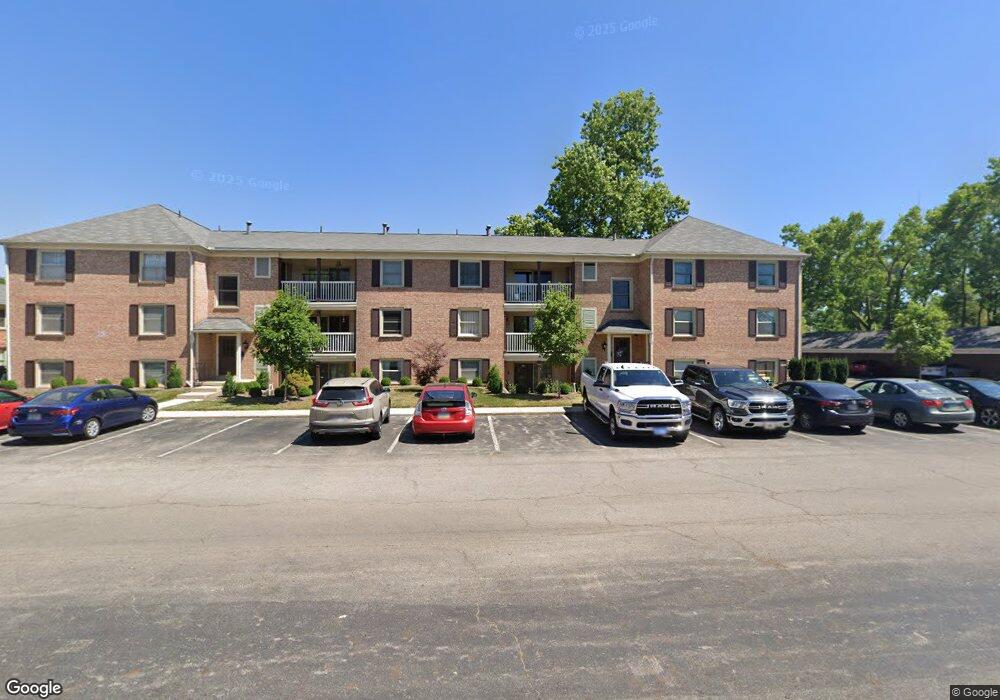
892 Chatham Ln Unit 892W Columbus, OH 43221
Cranbrook NeighborhoodEstimated Value: $147,000 - $155,398
1
Bed
1
Bath
699
Sq Ft
$216/Sq Ft
Est. Value
About This Home
This home is located at 892 Chatham Ln Unit 892W, Columbus, OH 43221 and is currently estimated at $150,850, approximately $215 per square foot. 892 Chatham Ln Unit 892W is a home located in Franklin County with nearby schools including Cranbrook Elementary School, Ridgeview Middle School, and Centennial High School.
Ownership History
Date
Name
Owned For
Owner Type
Purchase Details
Closed on
Jan 28, 2009
Sold by
Premanandan Christopher
Bought by
Sablosky Daniel J
Current Estimated Value
Home Financials for this Owner
Home Financials are based on the most recent Mortgage that was taken out on this home.
Original Mortgage
$58,800
Outstanding Balance
$37,347
Interest Rate
5.19%
Mortgage Type
Purchase Money Mortgage
Estimated Equity
$113,503
Purchase Details
Closed on
Jan 2, 2008
Sold by
Premanandan Rosalin Premila and Premanandan Joseph
Bought by
Premanandan Christopher
Purchase Details
Closed on
Aug 28, 1997
Sold by
Holmes Monica
Bought by
Premanandan Rosalin Premila
Home Financials for this Owner
Home Financials are based on the most recent Mortgage that was taken out on this home.
Original Mortgage
$31,600
Interest Rate
7.37%
Purchase Details
Closed on
Oct 21, 1991
Purchase Details
Closed on
Dec 20, 1988
Create a Home Valuation Report for This Property
The Home Valuation Report is an in-depth analysis detailing your home's value as well as a comparison with similar homes in the area
Home Values in the Area
Average Home Value in this Area
Purchase History
| Date | Buyer | Sale Price | Title Company |
|---|---|---|---|
| Sablosky Daniel J | $73,500 | Talon Group | |
| Premanandan Christopher | -- | Talon Group | |
| Premanandan Rosalin Premila | $39,500 | Chicago Title | |
| -- | $35,000 | -- | |
| -- | $30,000 | -- |
Source: Public Records
Mortgage History
| Date | Status | Borrower | Loan Amount |
|---|---|---|---|
| Open | Sablosky Daniel J | $58,800 | |
| Previous Owner | Premanandan Rosalin Premila | $31,600 |
Source: Public Records
Tax History Compared to Growth
Tax History
| Year | Tax Paid | Tax Assessment Tax Assessment Total Assessment is a certain percentage of the fair market value that is determined by local assessors to be the total taxable value of land and additions on the property. | Land | Improvement |
|---|---|---|---|---|
| 2024 | $2,140 | $47,680 | $12,780 | $34,900 |
| 2023 | $2,113 | $47,670 | $12,775 | $34,895 |
| 2022 | $1,556 | $30,000 | $5,040 | $24,960 |
| 2021 | $1,559 | $30,000 | $5,040 | $24,960 |
| 2020 | $1,561 | $30,000 | $5,040 | $24,960 |
| 2019 | $1,516 | $24,990 | $4,200 | $20,790 |
| 2018 | $1,525 | $24,990 | $4,200 | $20,790 |
| 2017 | $1,515 | $24,990 | $4,200 | $20,790 |
| 2016 | $1,693 | $25,550 | $4,200 | $21,350 |
| 2015 | $1,536 | $25,550 | $4,200 | $21,350 |
| 2014 | $1,540 | $25,550 | $4,200 | $21,350 |
| 2013 | $760 | $25,550 | $4,200 | $21,350 |
Source: Public Records
Map
Nearby Homes
- 965 Manor Ln Unit W
- 965 Manor Ln Unit P
- 1111 Sunny Hill Dr
- 667 Riverview Dr
- 1098 Stanhope Dr
- 905 Caniff Rd
- 1205 Sunny Hill Dr
- 3311 Mansion Way
- 1016 Lambeth Dr
- 3156 Mt Holyoke Rd
- 3066 Dorris Ave Unit 3066
- 1311 La Rochelle Dr Unit B2L
- 187 W Pacemont Rd Unit 189
- 3526 Rue de Fleur Unit B18U
- 143 W Pacemont Rd Unit 145
- 110 W Tulane Rd
- 1550 College Hill Dr
- 2727 Westmont Blvd
- 1560 Pemberton Dr
- 116 Olentangy Point Unit J116
- 892 Chatham Ln Unit 892B
- 892 Chatham Ln Unit 892C
- 892 Chatham Ln
- 892 Chatham Ln Unit 892Y
- 892 Chatham Ln Unit 892A
- 892 Chatham Ln
- 892 Chatham Ln Unit 892V
- 892 Chatham Ln
- 892 Chatham Ln Unit 892H
- 892 Chatham Ln
- 892 Chatham Ln
- 892 Chatham Ln Unit 892Z
- 892 Chatham Ln
- 892 Chatham Ln Unit 892R
- 892 Chatham Ln
- 892 Chatham Ln
- 892 Chatham Ln
- 892 Chatham Ln
- 892 Chatham Ln
- 892 Chatham Ln