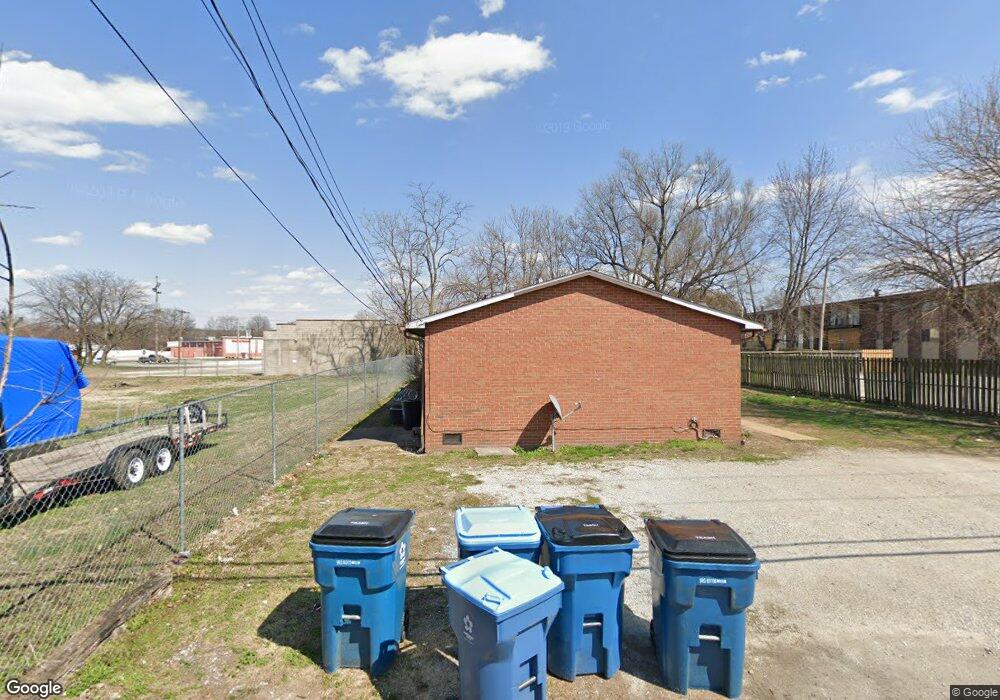
892 Haller St Wood River, IL 62095
Estimated Value: $114,573 - $168,000
3
Beds
3
Baths
2,160
Sq Ft
$63/Sq Ft
Est. Value
About This Home
This home is located at 892 Haller St, Wood River, IL 62095 and is currently estimated at $136,893, approximately $63 per square foot. 892 Haller St is a home located in Madison County with nearby schools including Eastwood Elementary School, East Alton Middle School, and East Alton-Wood River High School.
Ownership History
Date
Name
Owned For
Owner Type
Purchase Details
Closed on
Mar 26, 2021
Sold by
Bettorf Robert B
Bought by
Naya Properties Llc
Current Estimated Value
Home Financials for this Owner
Home Financials are based on the most recent Mortgage that was taken out on this home.
Original Mortgage
$68,000
Outstanding Balance
$61,297
Interest Rate
2.9%
Mortgage Type
New Conventional
Estimated Equity
$75,596
Purchase Details
Closed on
Sep 4, 2008
Sold by
Lasalle Bank Na
Bought by
Bettorf Robert B
Purchase Details
Closed on
Feb 22, 2008
Sold by
Lattimore Jeffrey A
Bought by
Aurora Loan Services Llc
Purchase Details
Closed on
Sep 2, 2005
Sold by
Walleck Timothy J
Bought by
Lattimore Jeffrey A
Home Financials for this Owner
Home Financials are based on the most recent Mortgage that was taken out on this home.
Original Mortgage
$89,600
Interest Rate
5.89%
Mortgage Type
Commercial
Create a Home Valuation Report for This Property
The Home Valuation Report is an in-depth analysis detailing your home's value as well as a comparison with similar homes in the area
Home Values in the Area
Average Home Value in this Area
Purchase History
| Date | Buyer | Sale Price | Title Company |
|---|---|---|---|
| Naya Properties Llc | $80,000 | Community Title & Escrow | |
| Bettorf Robert B | $76,000 | Chicago Title Insurance Co | |
| Aurora Loan Services Llc | -- | None Available | |
| Lattimore Jeffrey A | $112,000 | First American Title Ins Co |
Source: Public Records
Mortgage History
| Date | Status | Borrower | Loan Amount |
|---|---|---|---|
| Open | Naya Properties Llc | $68,000 | |
| Previous Owner | Lattimore Jeffrey A | $89,600 |
Source: Public Records
Tax History Compared to Growth
Tax History
| Year | Tax Paid | Tax Assessment Tax Assessment Total Assessment is a certain percentage of the fair market value that is determined by local assessors to be the total taxable value of land and additions on the property. | Land | Improvement |
|---|---|---|---|---|
| 2024 | $3,215 | $34,390 | $2,900 | $31,490 |
| 2023 | $3,215 | $32,060 | $2,700 | $29,360 |
| 2022 | $3,039 | $29,590 | $2,490 | $27,100 |
| 2021 | $2,911 | $27,580 | $2,320 | $25,260 |
| 2020 | $2,845 | $26,560 | $2,230 | $24,330 |
| 2019 | $2,784 | $25,770 | $2,160 | $23,610 |
| 2018 | $2,722 | $24,490 | $2,050 | $22,440 |
| 2017 | $2,584 | $23,900 | $2,000 | $21,900 |
| 2016 | $2,639 | $23,900 | $2,000 | $21,900 |
| 2015 | $2,626 | $23,650 | $1,980 | $21,670 |
| 2014 | $2,626 | $23,650 | $1,980 | $21,670 |
| 2013 | $2,626 | $23,990 | $2,010 | $21,980 |
Source: Public Records
Map
Nearby Homes
- 833 State St
- 98 Wood River Ave
- 133 Lincoln Ave
- 777 Condit St
- 209 Elble Ave
- 121 Whitelaw Ave
- 104 Whitelaw Ave
- 726 Rice St
- 330 S Pence St
- 420 Bowman Ave
- 959 Cedar Dr
- 523 Lincoln Ave
- 109 S Shamrock St
- 641 Leslie Ave
- 345 Illinois Ave
- 523 Broadway
- 469 N 1st St
- 523 Wilson Ave
- 140 Victory Dr
- 604 Wood River Ave