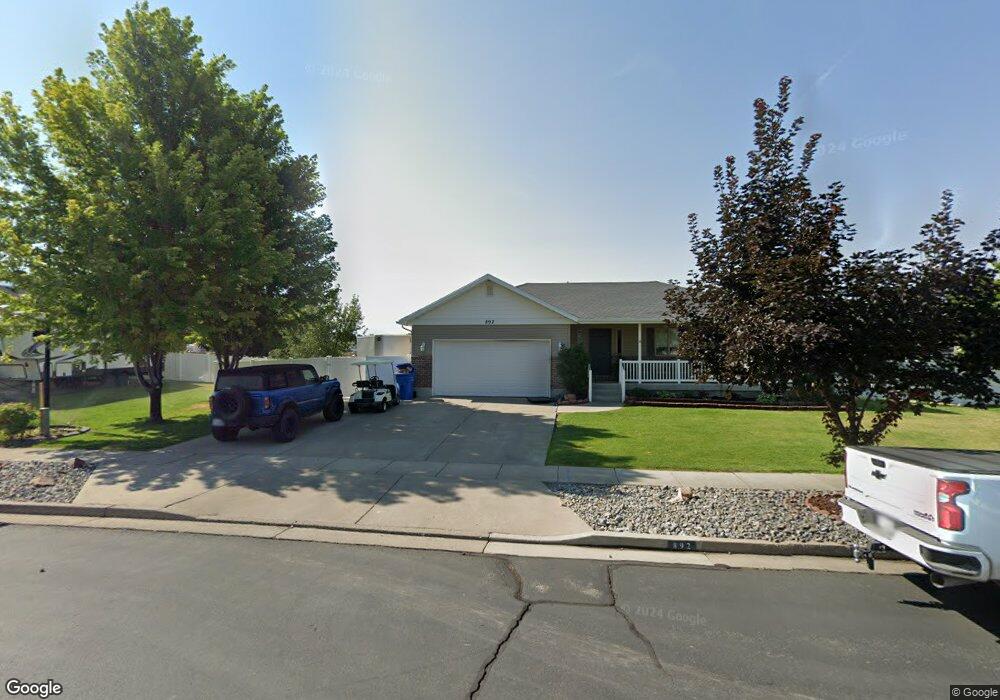
892 W 2980 S Nibley, UT 84321
Estimated Value: $567,286 - $596,000
5
Beds
3
Baths
3,306
Sq Ft
$176/Sq Ft
Est. Value
About This Home
This home is located at 892 W 2980 S, Nibley, UT 84321 and is currently estimated at $581,572, approximately $175 per square foot. 892 W 2980 S is a home located in Cache County with nearby schools including Heritage School, Spring Creek Middle School, and South Cache Middle School.
Ownership History
Date
Name
Owned For
Owner Type
Purchase Details
Closed on
Mar 28, 2024
Sold by
Albrecht Don and Albrecht Carol
Bought by
Archibald Tosha and Archibald Kody
Current Estimated Value
Home Financials for this Owner
Home Financials are based on the most recent Mortgage that was taken out on this home.
Original Mortgage
$350,000
Outstanding Balance
$344,660
Interest Rate
6.77%
Mortgage Type
New Conventional
Estimated Equity
$236,912
Purchase Details
Closed on
Aug 4, 2007
Sold by
Hansen Thomas M and Hansen Rebecca A
Bought by
Albrecht Don and Albrecht Carol
Home Financials for this Owner
Home Financials are based on the most recent Mortgage that was taken out on this home.
Original Mortgage
$161,800
Interest Rate
5.41%
Mortgage Type
New Conventional
Create a Home Valuation Report for This Property
The Home Valuation Report is an in-depth analysis detailing your home's value as well as a comparison with similar homes in the area
Home Values in the Area
Average Home Value in this Area
Purchase History
| Date | Buyer | Sale Price | Title Company |
|---|---|---|---|
| Archibald Tosha | -- | Prospect Title Insurance Agenc | |
| Albrecht Don | -- | Cache Title Company |
Source: Public Records
Mortgage History
| Date | Status | Borrower | Loan Amount |
|---|---|---|---|
| Open | Archibald Tosha | $350,000 | |
| Previous Owner | Albrecht Don | $64,950 | |
| Previous Owner | Albrecht Don | $161,800 |
Source: Public Records
Tax History Compared to Growth
Tax History
| Year | Tax Paid | Tax Assessment Tax Assessment Total Assessment is a certain percentage of the fair market value that is determined by local assessors to be the total taxable value of land and additions on the property. | Land | Improvement |
|---|---|---|---|---|
| 2024 | $2,422 | $301,465 | $0 | $0 |
| 2023 | $2,304 | $268,480 | $0 | $0 |
| 2022 | $2,398 | $268,480 | $0 | $0 |
| 2021 | $2,321 | $403,520 | $65,000 | $338,520 |
| 2020 | $2,268 | $375,431 | $65,000 | $310,431 |
| 2019 | $2,379 | $375,431 | $65,000 | $310,431 |
| 2018 | $2,013 | $309,940 | $40,000 | $269,940 |
| 2017 | $1,925 | $156,970 | $0 | $0 |
| 2016 | $1,946 | $148,005 | $0 | $0 |
| 2015 | $1,494 | $121,275 | $0 | $0 |
| 2014 | $1,460 | $121,275 | $0 | $0 |
| 2013 | -- | $124,025 | $0 | $0 |
Source: Public Records
Map
Nearby Homes
- 892 Forest Ln Unit 25
- 876 Forest Ln Unit 24
- 908 W 2980 S
- 876 W 2980 S
- 891 Forest Ln
- 891 Forest Ln Unit 4
- 891 Forest Ln
- 891 W 2980 S
- 875 Forest Ln Unit 5
- 875 Forest Ln
- 860 W 2980 S
- 875 W 2980 S
- 924 W 2980 S
- 923 W 2980 S
- 857 Forest Ln Unit 6
- 894 Garden Cir Unit 9
- 878 Garden Cir Unit 8
- 878 Garden Cir
- 940 W 2980 S
- 848 W 2980 S