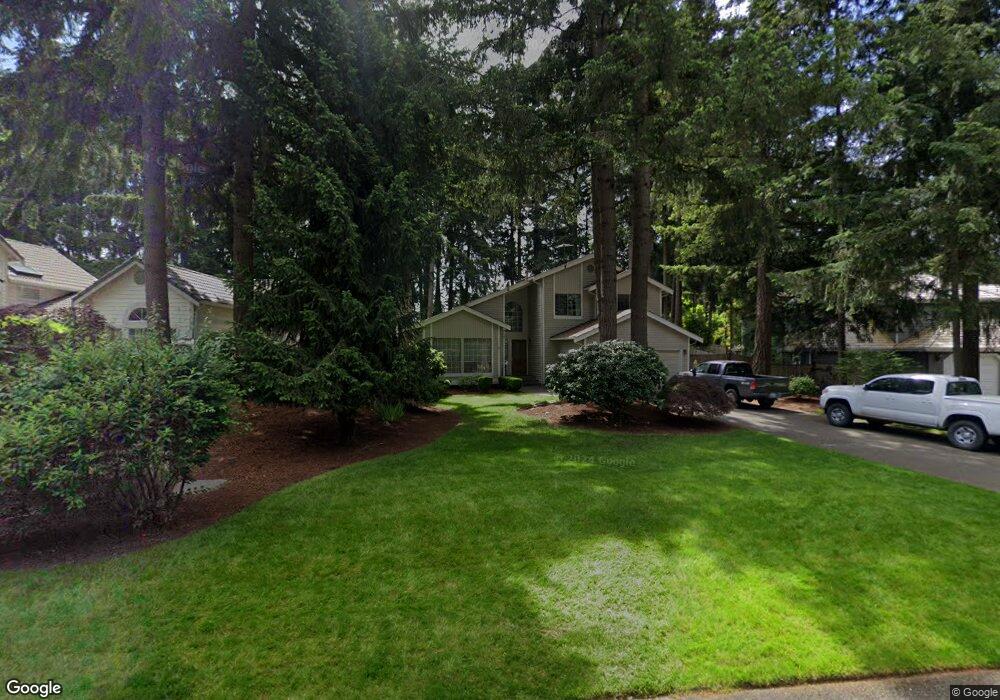
8920 166th St E Puyallup, WA 98375
Estimated Value: $546,000 - $613,000
3
Beds
3
Baths
1,820
Sq Ft
$314/Sq Ft
Est. Value
About This Home
This home is located at 8920 166th St E, Puyallup, WA 98375 and is currently estimated at $570,810, approximately $313 per square foot. 8920 166th St E is a home located in Pierce County with nearby schools including Brouillet Elementary School, Stahl Junior High, and Gov. John Rogers High School.
Ownership History
Date
Name
Owned For
Owner Type
Purchase Details
Closed on
Jan 25, 2007
Sold by
Gilmore David W and Gilmore Leslee A
Bought by
Emmons Duane Michael and Emmons Anja
Current Estimated Value
Home Financials for this Owner
Home Financials are based on the most recent Mortgage that was taken out on this home.
Original Mortgage
$247,900
Outstanding Balance
$148,564
Interest Rate
6.17%
Mortgage Type
Purchase Money Mortgage
Estimated Equity
$422,246
Purchase Details
Closed on
Nov 5, 2002
Sold by
Joubert Pierre J
Bought by
Gilmore David W and Gilmore Leslee A
Home Financials for this Owner
Home Financials are based on the most recent Mortgage that was taken out on this home.
Original Mortgage
$211,140
Interest Rate
5.88%
Mortgage Type
VA
Purchase Details
Closed on
Dec 15, 1998
Sold by
Garcia Xavier O
Bought by
Joubert Ronda M and Joubert Pierre J
Home Financials for this Owner
Home Financials are based on the most recent Mortgage that was taken out on this home.
Original Mortgage
$156,150
Interest Rate
6.91%
Create a Home Valuation Report for This Property
The Home Valuation Report is an in-depth analysis detailing your home's value as well as a comparison with similar homes in the area
Home Values in the Area
Average Home Value in this Area
Purchase History
| Date | Buyer | Sale Price | Title Company |
|---|---|---|---|
| Emmons Duane Michael | $309,950 | Fidelity Natl Title Ins Co | |
| Gilmore David W | $207,000 | Fidelity National Title Co | |
| Joubert Ronda M | $161,000 | First American Title Ins Co |
Source: Public Records
Mortgage History
| Date | Status | Borrower | Loan Amount |
|---|---|---|---|
| Open | Emmons Duane Michael | $247,900 | |
| Previous Owner | Gilmore David W | $211,140 | |
| Previous Owner | Joubert Ronda M | $156,150 |
Source: Public Records
Tax History
| Year | Tax Paid | Tax Assessment Tax Assessment Total Assessment is a certain percentage of the fair market value that is determined by local assessors to be the total taxable value of land and additions on the property. | Land | Improvement |
|---|---|---|---|---|
| 2025 | $4,750 | $477,600 | $177,400 | $300,200 |
| 2024 | $4,750 | $466,600 | $184,200 | $282,400 |
| 2023 | $4,750 | $445,800 | $184,200 | $261,600 |
| 2022 | $4,708 | $461,300 | $184,200 | $277,100 |
| 2021 | $4,645 | $359,300 | $132,900 | $226,400 |
| 2019 | $4,155 | $336,900 | $117,100 | $219,800 |
| 2018 | $4,168 | $305,900 | $101,200 | $204,700 |
| 2017 | $3,851 | $280,000 | $88,800 | $191,200 |
| 2016 | $3,518 | $232,500 | $70,200 | $162,300 |
| 2014 | $3,040 | $213,600 | $57,200 | $156,400 |
| 2013 | $3,040 | $191,100 | $50,600 | $140,500 |
Source: Public Records
Map
Nearby Homes
- 7714 166th St E
- 8816 164th St E
- 9401 167th Street Ct E
- 8515 166th Street Ct E
- 16909 95th Ave E
- 8508 165th Street Ct E
- 17114 89th Avenue Ct E
- 8929 160th Street Ct E
- 8412 165th Street Ct E
- 17209 92nd Ave E
- 8717 161st St E
- 8410 162nd Street Ct E
- 15813 93rd Ave E
- 17317 94th Avenue Ct E
- 16111 97th Avenue Ct E
- 17211 83rd Avenue Ct E
- 8716 157th Street Ct E
- 9016 176th Street Ct E
- 17315 97th Avenue Ct E
- 17313 82nd Ave E
- 8922 166th St E
- 8918 166th St E
- 9014 166th St E
- 9003 166th Street Ct E
- 9001 166th Street Ct E
- 9003 166th Street Ct E
- 8919 166th St E
- 8921 166th St E
- 9007 166th Street Ct E
- 9016 166th St E
- 9009 166th Street Ct E
- 16516 90th Ave E
- 9018 166th St E
- 16519 90th Ave E
- 16702 90th Ave E
- 8919 168th St E
- 16703 90th Ave E
- 16517 90th Ave E
- 16514 90th Ave E
- 9020 166th St E
Your Personal Tour Guide
Ask me questions while you tour the home.