Estimated Value: $472,000 - $559,000
4
Beds
2
Baths
1,830
Sq Ft
$280/Sq Ft
Est. Value
About This Home
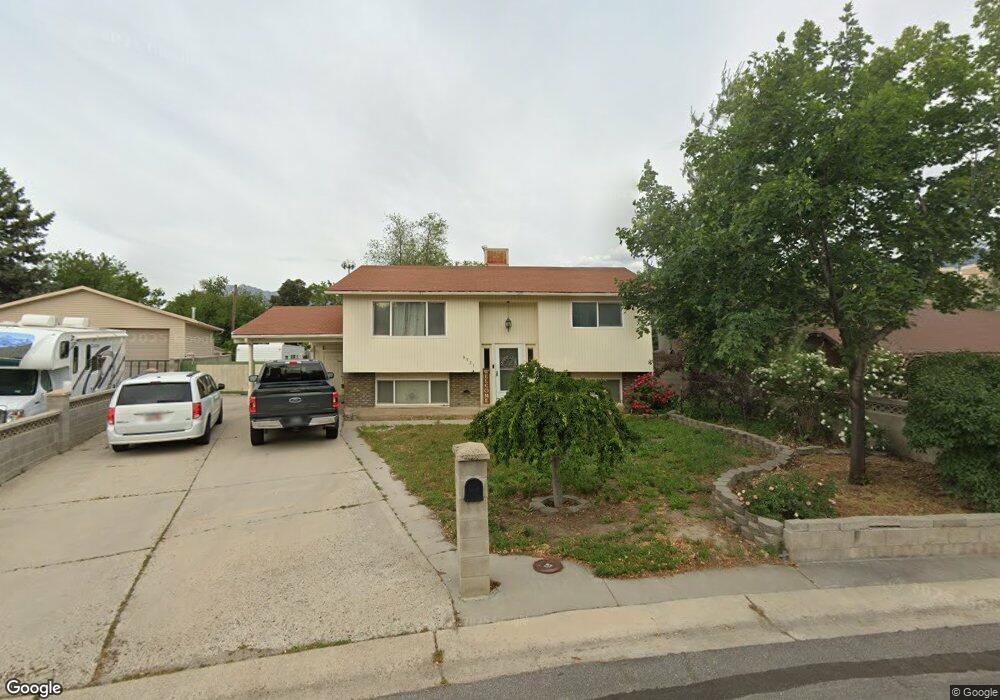
This home is located at 8921 S Mingo Park Dr, Sandy, UT 84070 and is currently estimated at $512,395, approximately $279 per square foot. 8921 S Mingo Park Dr is a home located in Salt Lake County with nearby schools including Sandy Elementary School, Mount Jordan Middle School, and Jordan High.
Ownership History
Date
Name
Owned For
Owner Type
Purchase Details
Closed on
Nov 8, 2021
Sold by
Volpe Tristan N and Anderton Lindsey Haley
Bought by
Volpe Tristan and Anderton Lindsey Haley
Current Estimated Value
Home Financials for this Owner
Home Financials are based on the most recent Mortgage that was taken out on this home.
Original Mortgage
$242,300
Outstanding Balance
$201,078
Interest Rate
3.01%
Mortgage Type
New Conventional
Estimated Equity
$311,317
Purchase Details
Closed on
Nov 9, 2017
Sold by
Bates Jeremy D and Bates Heidi M
Bought by
Volpe Tristan N and Anderton Lindsey Haley
Home Financials for this Owner
Home Financials are based on the most recent Mortgage that was taken out on this home.
Original Mortgage
$256,155
Interest Rate
3.75%
Mortgage Type
FHA
Purchase Details
Closed on
Feb 17, 2009
Sold by
Kap Llc
Bought by
Bates Jeremy D and Bates Heidi M
Purchase Details
Closed on
Jan 22, 2009
Sold by
Bates Jeremy D and Bates Heidi M
Bought by
Kap Llc
Purchase Details
Closed on
Jul 11, 2006
Sold by
Bates Jeremy D and Bates Heidi M
Bought by
Bates Jeremy D and Bates Heidi M
Home Financials for this Owner
Home Financials are based on the most recent Mortgage that was taken out on this home.
Original Mortgage
$36,200
Interest Rate
6.66%
Mortgage Type
Stand Alone Second
Purchase Details
Closed on
Jun 26, 2006
Sold by
Rizzuto Jacob M and Rizzuto Leigh B
Bought by
Bates Jeremy D and Bates Heidi M
Home Financials for this Owner
Home Financials are based on the most recent Mortgage that was taken out on this home.
Original Mortgage
$36,200
Interest Rate
6.66%
Mortgage Type
Stand Alone Second
Purchase Details
Closed on
Aug 17, 2001
Sold by
Federal National Mortgage Association
Bought by
Rizzuto Jacob M and Rizzuto Leigh B
Home Financials for this Owner
Home Financials are based on the most recent Mortgage that was taken out on this home.
Original Mortgage
$105,600
Interest Rate
8.37%
Purchase Details
Closed on
Jan 23, 2001
Sold by
Greer Guy L and Greer Judy M
Bought by
Greer Guy L and Greer Judy M
Purchase Details
Closed on
Nov 10, 2000
Sold by
Wells Fargo Home Mtg Inc
Bought by
Federal National Mortgage Association
Purchase Details
Closed on
Aug 8, 1994
Sold by
Crump Gayle
Bought by
Green William L and Green Joann
Home Financials for this Owner
Home Financials are based on the most recent Mortgage that was taken out on this home.
Original Mortgage
$56,942
Interest Rate
8.65%
Create a Home Valuation Report for This Property
The Home Valuation Report is an in-depth analysis detailing your home's value as well as a comparison with similar homes in the area
Home Values in the Area
Average Home Value in this Area
Purchase History
| Date | Buyer | Sale Price | Title Company |
|---|---|---|---|
| Volpe Tristan | -- | Gateway Title Ins Agcy Llc | |
| Volpe Tristan N | -- | Gt Title Services Slc | |
| Bates Jeremy D | -- | Accommodation | |
| Kap Llc | -- | Accommodation | |
| Bates Jeremy D | -- | Hickman Land Title Co | |
| Bates Jeremy D | -- | Hickman Land Title Co | |
| Rizzuto Jacob M | $132,000 | Empire Land Title Inc | |
| Greer Guy L | -- | -- | |
| Federal National Mortgage Association | -- | Backman Stewart Title Servic | |
| Wells Fargo Home Mtg Inc | $127,556 | Backman Stewart Title Servic | |
| Green William L | -- | -- |
Source: Public Records
Mortgage History
| Date | Status | Borrower | Loan Amount |
|---|---|---|---|
| Open | Volpe Tristan | $242,300 | |
| Closed | Volpe Tristan N | $256,155 | |
| Previous Owner | Bates Jeremy D | $36,200 | |
| Previous Owner | Bates Jeremy D | $144,800 | |
| Previous Owner | Rizzuto Jacob M | $105,600 | |
| Previous Owner | Green William L | $56,942 | |
| Closed | Rizzuto Jacob M | $26,400 |
Source: Public Records
Tax History Compared to Growth
Tax History
| Year | Tax Paid | Tax Assessment Tax Assessment Total Assessment is a certain percentage of the fair market value that is determined by local assessors to be the total taxable value of land and additions on the property. | Land | Improvement |
|---|---|---|---|---|
| 2025 | $2,585 | $484,400 | $137,900 | $346,500 |
| 2024 | $2,585 | $478,100 | $129,600 | $348,500 |
| 2023 | $2,312 | $426,400 | $123,200 | $303,200 |
| 2022 | $2,435 | $438,700 | $120,800 | $317,900 |
| 2021 | $2,174 | $333,300 | $105,000 | $228,300 |
| 2020 | $2,068 | $299,100 | $85,100 | $214,000 |
| 2019 | $2,005 | $282,500 | $85,100 | $197,400 |
| 2018 | $1,841 | $270,100 | $85,100 | $185,000 |
| 2017 | $1,513 | $212,000 | $75,600 | $136,400 |
| 2016 | $1,524 | $206,500 | $75,600 | $130,900 |
| 2015 | $1,558 | $195,300 | $78,600 | $116,700 |
| 2014 | $1,526 | $187,500 | $76,400 | $111,100 |
Source: Public Records
Map
Nearby Homes
- 8915 S 660 E Unit 103
- 608 E 8800 S
- 8732 S 620 E
- 775 E Autumn Field Dr
- 8729 S Leafwood Ln
- 627 E 8680 S
- 8722 S Oakwood Park Cir Unit 8722
- 8823 S 300 E
- 807 E Whisper Cove Rd
- 354 E 8620 S
- 8550 S 570 E
- 9092 Enchanted Oak Ln
- 9083 Enchanted Oak Ln
- 547 E Pioneer Ave
- 8731 Gladiator Way
- 783 E Newfield Dr Unit 146
- 9144 S Peach Blossom Dr
- 386 Pioneer Ave
- 9191 S 220 E
- 9055 Jason K Cir Unit 4A
- 8921 Mingo Park Dr
- 579 Mingo Park Dr
- 8931 Mingo Park Dr
- 8943 Mingo Park Dr
- 602 Locust St
- 590 Locust St
- 578 Locust St
- 568 Mingo Park Dr
- 567 Mingo Park Dr
- 614 E Locust St
- 8953 Mingo Park Dr
- 626 E Locust St
- 565 Mingo View Ave
- 554 Mingo Park Dr
- 626 E Locust St
- 566 Locust St
- 8963 S Mingo Park Dr
- 8963 Mingo Park Dr
- 636 E Locust St
- 8909 S 540 E