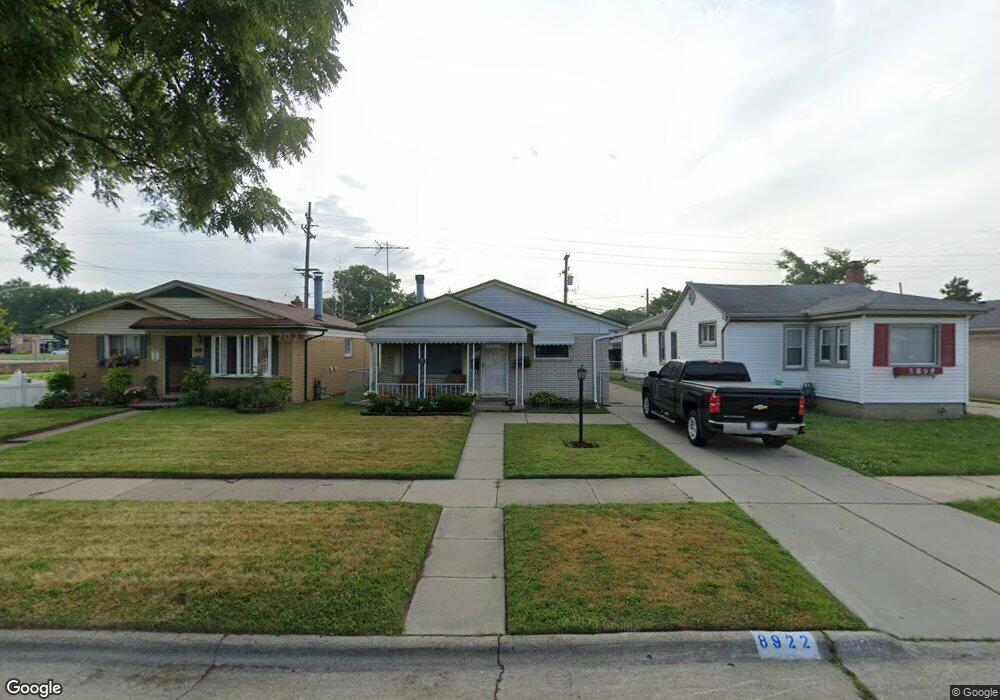
8922 Woodbine Redford, MI 48239
Estimated Value: $188,709 - $209,000
3
Beds
2
Baths
1,040
Sq Ft
$191/Sq Ft
Est. Value
About This Home
This home is located at 8922 Woodbine, Redford, MI 48239 and is currently estimated at $198,177, approximately $190 per square foot. 8922 Woodbine is a home located in Wayne County with nearby schools including John D. Pierce Middle School, Lee M. Thurston High School, and Global Heights Academy.
Ownership History
Date
Name
Owned For
Owner Type
Purchase Details
Closed on
Sep 8, 2011
Sold by
Haria Snehal
Bought by
Angel Solutions Ii Llc
Current Estimated Value
Purchase Details
Closed on
Jun 10, 2011
Sold by
Wtotw Homes Llc
Bought by
Haria Snehal
Purchase Details
Closed on
Mar 6, 2009
Sold by
Trott & Trott Pc
Bought by
Wtotw Homes Llc
Purchase Details
Closed on
Jun 11, 2008
Sold by
Citimortgage Inc
Bought by
Federal National Mortgage Association
Purchase Details
Closed on
Apr 26, 2005
Sold by
Kotlarz Donald and Kotlarz Debra Lynn
Bought by
Patton Vivian
Create a Home Valuation Report for This Property
The Home Valuation Report is an in-depth analysis detailing your home's value as well as a comparison with similar homes in the area
Home Values in the Area
Average Home Value in this Area
Purchase History
| Date | Buyer | Sale Price | Title Company |
|---|---|---|---|
| Angel Solutions Ii Llc | -- | None Available | |
| Haria Snehal | $38,000 | Bell Title | |
| Wtotw Homes Llc | $22,000 | Warranty Title Agency Llc | |
| Federal National Mortgage Association | -- | None Available | |
| Citimortgage Inc | $139,733 | None Available | |
| Patton Vivian | $138,700 | Multiple |
Source: Public Records
Tax History Compared to Growth
Tax History
| Year | Tax Paid | Tax Assessment Tax Assessment Total Assessment is a certain percentage of the fair market value that is determined by local assessors to be the total taxable value of land and additions on the property. | Land | Improvement |
|---|---|---|---|---|
| 2025 | $1,061 | $86,700 | $0 | $0 |
| 2024 | $1,061 | $81,200 | $0 | $0 |
| 2023 | $1,014 | $73,200 | $0 | $0 |
| 2022 | $2,684 | $62,000 | $0 | $0 |
| 2021 | $2,605 | $56,900 | $0 | $0 |
| 2020 | $2,570 | $50,600 | $0 | $0 |
| 2019 | $2,517 | $45,700 | $0 | $0 |
| 2018 | $905 | $37,900 | $0 | $0 |
| 2017 | $2,746 | $36,000 | $0 | $0 |
| 2016 | $2,246 | $33,900 | $0 | $0 |
| 2015 | $2,725 | $30,500 | $0 | $0 |
| 2013 | $2,640 | $27,000 | $0 | $0 |
| 2012 | $2,297 | $29,800 | $6,600 | $23,200 |
Source: Public Records
Map
Nearby Homes