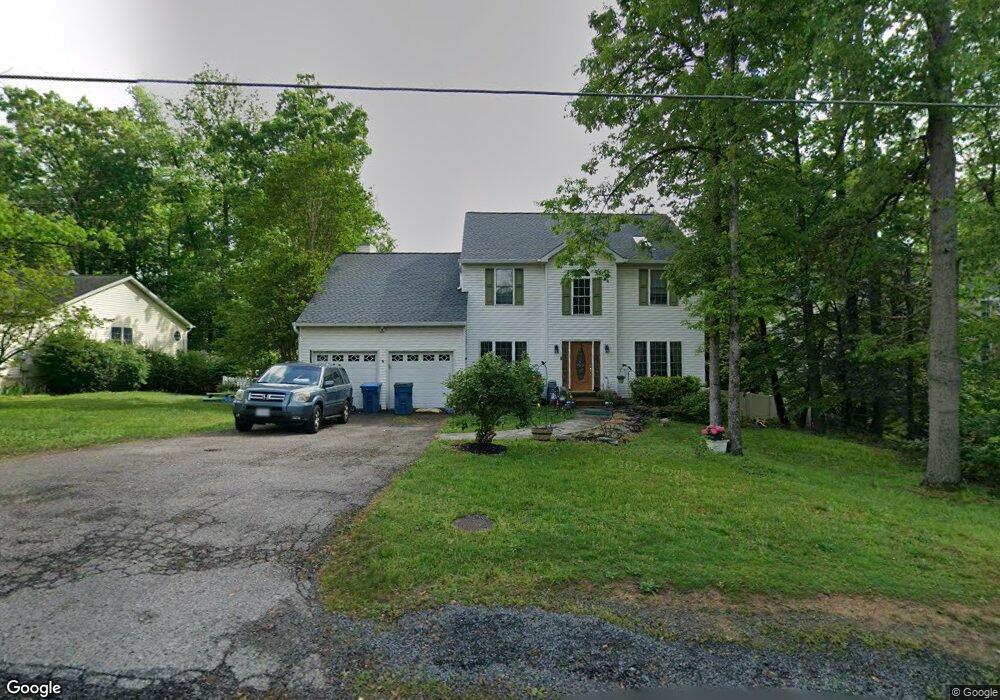
8923 Jameson St Lorton, VA 22079
Crosspointe NeighborhoodEstimated Value: $863,000 - $976,000
4
Beds
3
Baths
2,418
Sq Ft
$372/Sq Ft
Est. Value
About This Home
This home is located at 8923 Jameson St, Lorton, VA 22079 and is currently estimated at $898,447, approximately $371 per square foot. 8923 Jameson St is a home located in Fairfax County with nearby schools including Halley Elementary School, South County Middle School, and South County High School.
Ownership History
Date
Name
Owned For
Owner Type
Purchase Details
Closed on
Aug 1, 1994
Sold by
Kenney Builders Inc
Bought by
Ammirati Joseph T
Current Estimated Value
Home Financials for this Owner
Home Financials are based on the most recent Mortgage that was taken out on this home.
Original Mortgage
$184,900
Interest Rate
8.25%
Purchase Details
Closed on
May 10, 1994
Sold by
Perch Assoc Lp
Bought by
Kenney Builders Inc
Home Financials for this Owner
Home Financials are based on the most recent Mortgage that was taken out on this home.
Original Mortgage
$20,000
Interest Rate
7.7%
Create a Home Valuation Report for This Property
The Home Valuation Report is an in-depth analysis detailing your home's value as well as a comparison with similar homes in the area
Home Values in the Area
Average Home Value in this Area
Purchase History
| Date | Buyer | Sale Price | Title Company |
|---|---|---|---|
| Ammirati Joseph T | $45,000 | -- | |
| Kenney Builders Inc | $78,000 | -- |
Source: Public Records
Mortgage History
| Date | Status | Borrower | Loan Amount |
|---|---|---|---|
| Closed | Kenney Builders Inc | $184,900 | |
| Previous Owner | Kenney Builders Inc | $20,000 | |
| Closed | Kenney Builders Inc | $20,000 |
Source: Public Records
Tax History
| Year | Tax Paid | Tax Assessment Tax Assessment Total Assessment is a certain percentage of the fair market value that is determined by local assessors to be the total taxable value of land and additions on the property. | Land | Improvement |
|---|---|---|---|---|
| 2025 | $8,811 | $829,870 | $448,000 | $381,870 |
| 2024 | $8,811 | $760,580 | $407,000 | $353,580 |
| 2023 | $9,752 | $864,190 | $433,000 | $431,190 |
| 2022 | $8,381 | $732,950 | $358,000 | $374,950 |
| 2021 | $7,613 | $648,780 | $314,000 | $334,780 |
| 2020 | $7,384 | $623,900 | $302,000 | $321,900 |
| 2019 | $6,845 | $578,370 | $296,000 | $282,370 |
| 2018 | $6,433 | $559,370 | $277,000 | $282,370 |
| 2017 | $7,119 | $613,150 | $277,000 | $336,150 |
| 2016 | $7,103 | $613,150 | $277,000 | $336,150 |
Source: Public Records
Map
Nearby Homes
- 9111 Wood Spice Ln
- 8501 Silverview Dr
- 8813 Telegraph Crossing Ct
- 8514 Oak Chase Cir
- 8757 Southern Oaks Place
- 8753 Southern Oaks Place
- 8761 Southern Oaks Place
- 8545 Blue Rock Ln
- 8217 Bayberry Ridge Rd
- 8970 Fascination Ct Unit 111
- 8717 Flowering Dogwood Ln
- 9223 Ox Rd
- 8811 Ox Rd
- 8661 Chase Glen Cir
- 8909 Yellow Daisy Place
- 0-0 Peniwill Dr
- 0-000 Peniwill Dr
- 0-00 Peniwill Dr
- 9200 Wrights Hollow Ln
- 9600 Nuthatch Dr
Your Personal Tour Guide
Ask me questions while you tour the home.