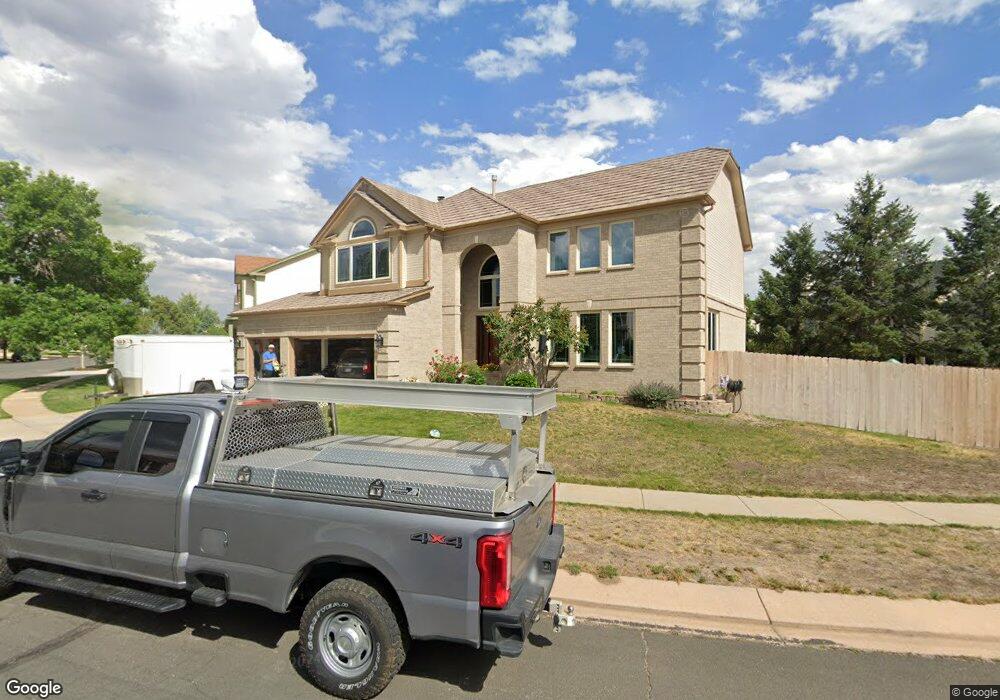
8925 Edgefield Dr Colorado Springs, CO 80920
Briargate NeighborhoodEstimated Value: $631,000 - $700,000
4
Beds
2
Baths
4,005
Sq Ft
$164/Sq Ft
Est. Value
About This Home
This home is located at 8925 Edgefield Dr, Colorado Springs, CO 80920 and is currently estimated at $655,510, approximately $163 per square foot. 8925 Edgefield Dr is a home located in El Paso County with nearby schools including Academy International Elementary School, Mountain Ridge Middle School, and Rampart High School.
Ownership History
Date
Name
Owned For
Owner Type
Purchase Details
Closed on
Nov 16, 2020
Sold by
Kelly Damian P and Kelly Catherine A
Bought by
Renslow Chad M and Renslow Ashley D
Current Estimated Value
Home Financials for this Owner
Home Financials are based on the most recent Mortgage that was taken out on this home.
Original Mortgage
$475,000
Outstanding Balance
$422,683
Interest Rate
2.8%
Mortgage Type
New Conventional
Estimated Equity
$232,827
Purchase Details
Closed on
Sep 26, 1995
Sold by
Ziobro Martin T and Ziobro Maureen Ann
Bought by
Kelly Damian P and Kelly Catherine A
Home Financials for this Owner
Home Financials are based on the most recent Mortgage that was taken out on this home.
Original Mortgage
$203,000
Interest Rate
7.88%
Mortgage Type
VA
Purchase Details
Closed on
Jun 8, 1993
Bought by
Kelly Damian P
Purchase Details
Closed on
Mar 22, 1993
Bought by
Kelly Damian P
Purchase Details
Closed on
Oct 16, 1992
Bought by
Kelly Catherine A
Create a Home Valuation Report for This Property
The Home Valuation Report is an in-depth analysis detailing your home's value as well as a comparison with similar homes in the area
Home Values in the Area
Average Home Value in this Area
Purchase History
| Date | Buyer | Sale Price | Title Company |
|---|---|---|---|
| Renslow Chad M | $500,000 | Unified Title Co | |
| Kelly Damian P | $203,500 | First American Title | |
| Kelly Damian P | $171,000 | -- | |
| Kelly Damian P | $29,000 | -- | |
| Kelly Catherine A | -- | -- |
Source: Public Records
Mortgage History
| Date | Status | Borrower | Loan Amount |
|---|---|---|---|
| Open | Renslow Chad M | $475,000 | |
| Previous Owner | Kelly Damian P | $203,000 |
Source: Public Records
Tax History Compared to Growth
Tax History
| Year | Tax Paid | Tax Assessment Tax Assessment Total Assessment is a certain percentage of the fair market value that is determined by local assessors to be the total taxable value of land and additions on the property. | Land | Improvement |
|---|---|---|---|---|
| 2025 | $2,512 | $41,790 | -- | -- |
| 2024 | $2,487 | $42,810 | $6,700 | $36,110 |
| 2022 | $2,292 | $32,480 | $5,420 | $27,060 |
| 2021 | $2,535 | $33,410 | $5,580 | $27,830 |
| 2020 | $1,883 | $30,290 | $4,650 | $25,640 |
| 2019 | $1,864 | $30,290 | $4,650 | $25,640 |
| 2018 | $1,427 | $24,620 | $3,600 | $21,020 |
| 2017 | $1,422 | $24,620 | $3,600 | $21,020 |
| 2016 | $1,371 | $24,740 | $3,660 | $21,080 |
| 2015 | $2,018 | $24,740 | $3,660 | $21,080 |
| 2014 | $1,887 | $23,120 | $3,660 | $19,460 |
Source: Public Records
Map
Nearby Homes
- 2560 Wimbleton Ct
- 8735 Chapel Square Ct
- 2730 Kenton Green Ct
- 2715 Heathrow Dr
- 2430 Linenhall Ct
- 2644 Marston Heights
- 2130 Wimbleton Ct
- 2656 Marston Heights
- 8935 Coberdale Ct
- 2340 Winstead View
- 2270 Cloverdale Dr
- 8335 Sutterfield Dr
- 9659 Carriage Creek Point
- 2479 Pine Valley View
- 1931 London Carriage Grove
- 2360 Pine Valley View
- 9506 Hollydale Ct
- 8161 Regiment Ct
- 8135 Portsmouth Ct
- 2114 Summerset Dr
- 8935 Edgefield Dr
- 8865 Edgefield Dr
- 8855 Edgefield Dr
- 8945 Edgefield Dr
- 8902 Edgefield Dr
- 8910 Edgefield Dr
- 8920 Edgefield Dr
- 8845 Edgefield Dr
- 8890 Edgefield Dr
- 8930 Edgefield Dr
- 8955 Edgefield Dr
- 8940 Edgefield Dr
- 8835 Edgefield Dr
- 8870 Edgefield Dr
- 8950 Edgefield Dr
- 8965 Edgefield Dr
- 8860 Edgefield Dr
- 8850 Edgefield Dr
- 8825 Edgefield Dr
- 8840 Edgefield Dr