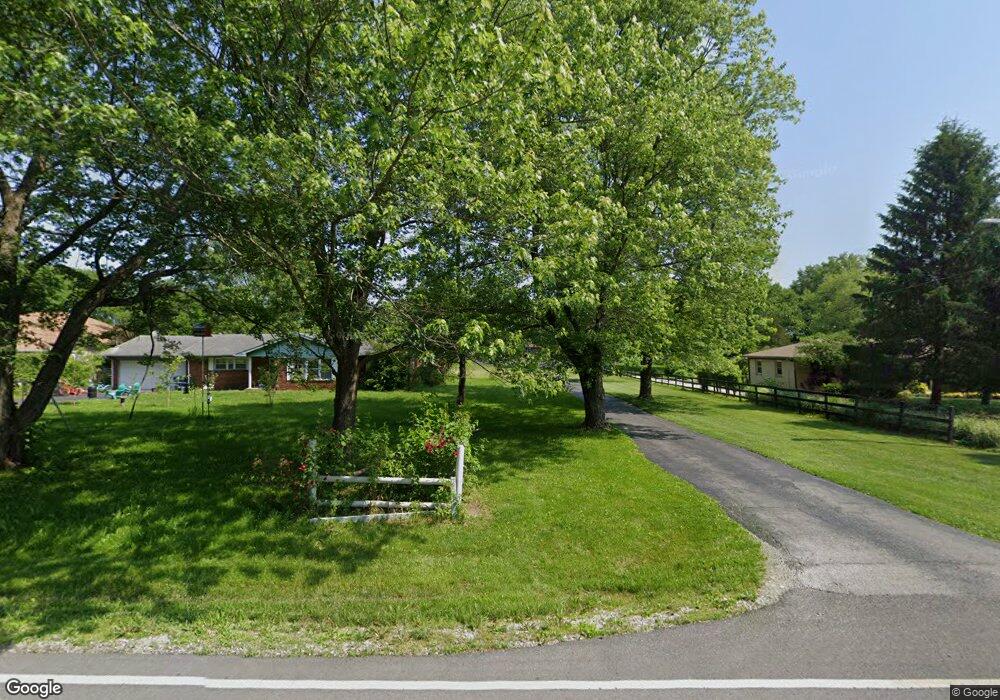
8926 Maze Rd Indianapolis, IN 46259
South Franklin NeighborhoodEstimated Value: $324,000 - $386,231
3
Beds
2
Baths
2,119
Sq Ft
$170/Sq Ft
Est. Value
About This Home
This home is located at 8926 Maze Rd, Indianapolis, IN 46259 and is currently estimated at $360,058, approximately $169 per square foot. 8926 Maze Rd is a home located in Marion County with nearby schools including Franklin Central High School.
Ownership History
Date
Name
Owned For
Owner Type
Purchase Details
Closed on
Aug 6, 2007
Sold by
Allen Norma Jo
Bought by
Burnett Bobby Joe
Current Estimated Value
Home Financials for this Owner
Home Financials are based on the most recent Mortgage that was taken out on this home.
Original Mortgage
$49,050
Outstanding Balance
$30,283
Interest Rate
6.72%
Mortgage Type
New Conventional
Estimated Equity
$329,775
Create a Home Valuation Report for This Property
The Home Valuation Report is an in-depth analysis detailing your home's value as well as a comparison with similar homes in the area
Home Values in the Area
Average Home Value in this Area
Purchase History
| Date | Buyer | Sale Price | Title Company |
|---|---|---|---|
| Burnett Bobby Joe | -- | None Available |
Source: Public Records
Mortgage History
| Date | Status | Borrower | Loan Amount |
|---|---|---|---|
| Open | Burnett Bobby Joe | $49,050 |
Source: Public Records
Tax History
| Year | Tax Paid | Tax Assessment Tax Assessment Total Assessment is a certain percentage of the fair market value that is determined by local assessors to be the total taxable value of land and additions on the property. | Land | Improvement |
|---|---|---|---|---|
| 2025 | $3,159 | $365,500 | $40,500 | $325,000 |
| 2024 | $3,159 | $305,400 | $40,500 | $264,900 |
| 2023 | $3,376 | $282,600 | $40,500 | $242,100 |
| 2022 | $3,414 | $282,600 | $40,500 | $242,100 |
| 2021 | $2,920 | $233,200 | $40,500 | $192,700 |
| 2020 | $3,013 | $245,700 | $38,800 | $206,900 |
| 2019 | $2,580 | $204,900 | $33,800 | $171,100 |
| 2018 | $2,574 | $205,000 | $33,800 | $171,200 |
| 2017 | $2,366 | $185,500 | $33,800 | $151,700 |
| 2016 | $2,333 | $183,100 | $33,800 | $149,300 |
| 2014 | $2,081 | $174,300 | $33,800 | $140,500 |
| 2013 | $2,145 | $174,300 | $33,800 | $140,500 |
Source: Public Records
Map
Nearby Homes
- 8304 Hunters Meadow Ct
- 8130 Grassy Meadow Ct
- 8204 Stoney Bend Cir
- 7635 Shady Trails Dr
- 8327 Frankdale Ct
- 8057 Meadow Bend Ln
- 8236 Holmard Place
- 8005 Stoney Bend Ct
- 7837 Park Ward Place
- 7975 Meadow Bend Cir
- 8131 Bentley Farms Place
- 1548 N Franklin Rd
- 7433 Deerberg Dr
- 7432 Leatherwood Dr
- 8105 Bentley Farms Dr
- 7409 Deerberg Dr
- 8214 Bentley Farms Dr
- 7407 Leatherwood Dr
- 7929 Meadow Bend Cir
- 7327 Raybourn Ct
Your Personal Tour Guide
Ask me questions while you tour the home.