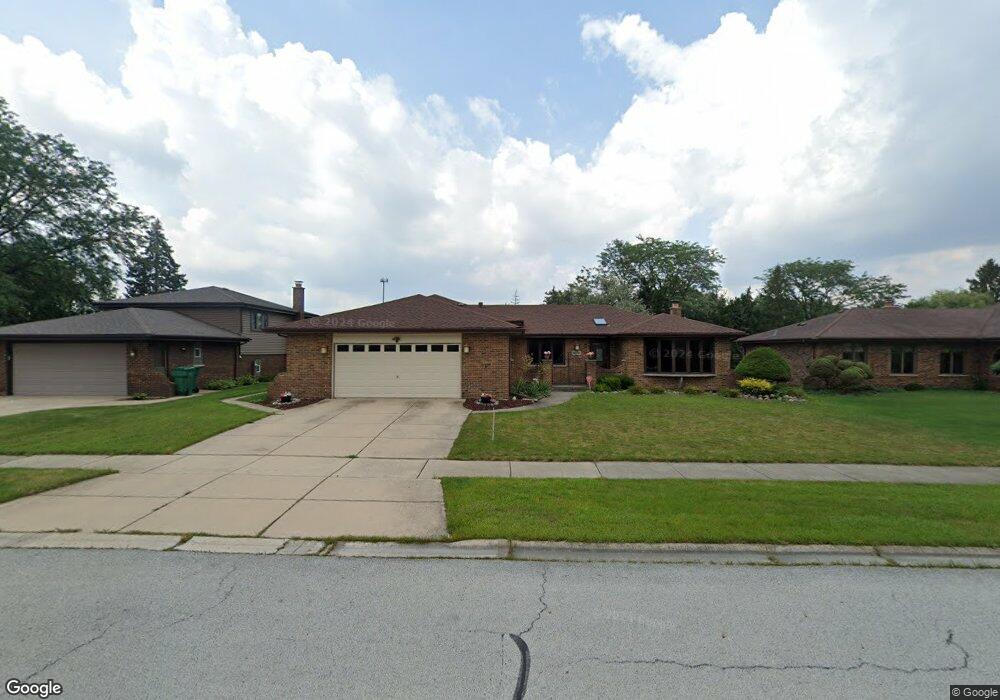
8926 Prestwick Ln Orland Park, IL 60462
Silver Lake North NeighborhoodEstimated Value: $426,000 - $471,000
3
Beds
3
Baths
1,937
Sq Ft
$233/Sq Ft
Est. Value
About This Home
This home is located at 8926 Prestwick Ln, Orland Park, IL 60462 and is currently estimated at $451,164, approximately $232 per square foot. 8926 Prestwick Ln is a home located in Cook County with nearby schools including Palos West Elementary School, Palos South Middle School, and Carl Sandburg High School.
Ownership History
Date
Name
Owned For
Owner Type
Purchase Details
Closed on
Jun 4, 2010
Sold by
Aprile Michael and Aprile Julie
Bought by
Sweiss Louis M
Current Estimated Value
Home Financials for this Owner
Home Financials are based on the most recent Mortgage that was taken out on this home.
Original Mortgage
$270,400
Outstanding Balance
$181,933
Interest Rate
5.05%
Mortgage Type
New Conventional
Estimated Equity
$269,231
Purchase Details
Closed on
Apr 11, 2003
Sold by
Stahr Dale R
Bought by
Aprile Michael and Aprile Julie
Home Financials for this Owner
Home Financials are based on the most recent Mortgage that was taken out on this home.
Original Mortgage
$261,000
Interest Rate
5.71%
Mortgage Type
Unknown
Purchase Details
Closed on
Sep 24, 2002
Sold by
Fifth Third Bank
Bought by
Stahr Dale R
Home Financials for this Owner
Home Financials are based on the most recent Mortgage that was taken out on this home.
Original Mortgage
$80,000
Interest Rate
6.34%
Create a Home Valuation Report for This Property
The Home Valuation Report is an in-depth analysis detailing your home's value as well as a comparison with similar homes in the area
Home Values in the Area
Average Home Value in this Area
Purchase History
| Date | Buyer | Sale Price | Title Company |
|---|---|---|---|
| Sweiss Louis M | $360,000 | Atgf Inc | |
| Aprile Michael | $290,000 | First American Title | |
| Aprile Michael | $290,000 | First American Title | |
| Stahr Dale R | -- | -- |
Source: Public Records
Mortgage History
| Date | Status | Borrower | Loan Amount |
|---|---|---|---|
| Open | Sweiss Louis M | $270,400 | |
| Previous Owner | Aprile Michael | $261,000 | |
| Previous Owner | Stahr Dale R | $80,000 |
Source: Public Records
Tax History Compared to Growth
Tax History
| Year | Tax Paid | Tax Assessment Tax Assessment Total Assessment is a certain percentage of the fair market value that is determined by local assessors to be the total taxable value of land and additions on the property. | Land | Improvement |
|---|---|---|---|---|
| 2024 | $4,550 | $36,000 | $9,300 | $26,700 |
| 2023 | $5,778 | $36,000 | $9,300 | $26,700 |
| 2022 | $5,778 | $29,744 | $8,100 | $21,644 |
| 2021 | $5,258 | $29,743 | $8,100 | $21,643 |
| 2020 | $4,705 | $29,743 | $8,100 | $21,643 |
| 2019 | $5,073 | $31,247 | $7,500 | $23,747 |
| 2018 | $4,954 | $31,247 | $7,500 | $23,747 |
| 2017 | $4,747 | $31,247 | $7,500 | $23,747 |
| 2016 | $6,019 | $27,804 | $6,600 | $21,204 |
| 2015 | $6,260 | $27,804 | $6,600 | $21,204 |
| 2014 | $6,217 | $27,804 | $6,600 | $21,204 |
| 2013 | $7,156 | $31,387 | $6,600 | $24,787 |
Source: Public Records
Map
Nearby Homes
- 13411 Westgate Ct
- 8841 Briarwood Ln
- 8756 Butterfield Ln
- 13520 Idlewild Dr
- 13315 Strawberry Ln
- 13550 86th Ave
- 9249 Dunmore Dr
- 8932 Pebble Beach Ln
- 13623 S 84th Ave
- 9590 Southmoor Dr
- 8820 W 140th St Unit 2A
- 8309 W 132nd St
- 9114 W 140th St Unit 204
- 9146 W 140th St Unit 3NE
- 13904 Virginia Ct
- 14040 Boxwood Ln
- 12604 S Pawnee Rd
- 12525 S Pawnee Rd
- 8132 Pickens Dr
- Richmond Plan at Misty Meadow
- 8920 Prestwick Ln
- 8932 Prestwick Ln
- 8923 Butterfield Ln
- 8914 Prestwick Ln
- 13338 Westgate Ct
- 8938 Medina Dr
- 8929 Prestwick Ln
- 8917 Butterfield Ln
- 8908 Prestwick Ln
- 13332 Medina Dr
- 13338 Medina Dr
- 8926 Butterfield Ln
- 13405 Medina Dr
- 13341 Westgate Ct
- 8902 Prestwick Ln
- 13402 Medina Dr
- 13408 Westgate Ct
- 8905 Butterfield Ln
- 13405 Westgate Ct
- 13411 Medina Dr