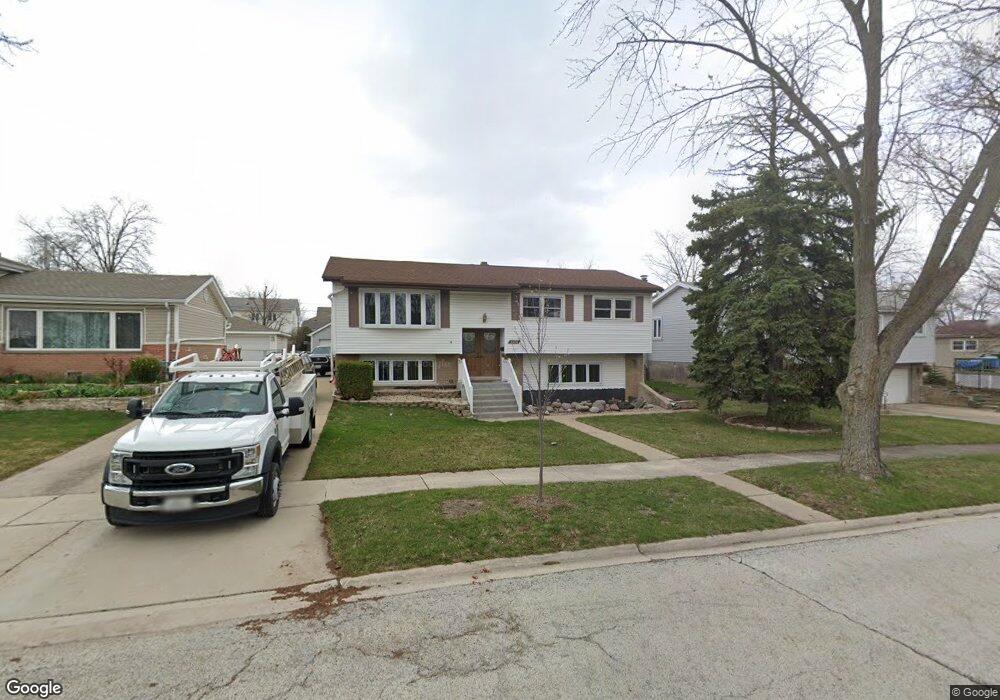
8926 Sycamore Dr Hickory Hills, IL 60457
Estimated Value: $347,702 - $391,000
3
Beds
2
Baths
1,144
Sq Ft
$319/Sq Ft
Est. Value
About This Home
This home is located at 8926 Sycamore Dr, Hickory Hills, IL 60457 and is currently estimated at $365,426, approximately $319 per square foot. 8926 Sycamore Dr is a home located in Cook County with nearby schools including Dorn Elementary School, Glen Oaks Elementary School, and H H Conrady Jr High School.
Ownership History
Date
Name
Owned For
Owner Type
Purchase Details
Closed on
Mar 22, 2002
Sold by
Schroeder Kathleen M
Bought by
Halloran Mark L and Halloran Kathleen Begley
Current Estimated Value
Home Financials for this Owner
Home Financials are based on the most recent Mortgage that was taken out on this home.
Original Mortgage
$168,300
Outstanding Balance
$69,660
Interest Rate
6.93%
Estimated Equity
$295,766
Purchase Details
Closed on
Jan 23, 2001
Sold by
Jones Thomas P
Bought by
Schroeder Kathleen M
Home Financials for this Owner
Home Financials are based on the most recent Mortgage that was taken out on this home.
Original Mortgage
$102,000
Interest Rate
7.18%
Purchase Details
Closed on
Apr 19, 1996
Sold by
Graham Joseph L and Graham Theresa E
Bought by
Jones Thomas P and Schroeder Kathleen M
Home Financials for this Owner
Home Financials are based on the most recent Mortgage that was taken out on this home.
Original Mortgage
$107,100
Interest Rate
7.91%
Create a Home Valuation Report for This Property
The Home Valuation Report is an in-depth analysis detailing your home's value as well as a comparison with similar homes in the area
Home Values in the Area
Average Home Value in this Area
Purchase History
| Date | Buyer | Sale Price | Title Company |
|---|---|---|---|
| Halloran Mark L | $187,000 | -- | |
| Schroeder Kathleen M | -- | First American Title | |
| Jones Thomas P | $153,000 | -- |
Source: Public Records
Mortgage History
| Date | Status | Borrower | Loan Amount |
|---|---|---|---|
| Open | Halloran Mark L | $168,300 | |
| Previous Owner | Schroeder Kathleen M | $102,000 | |
| Previous Owner | Jones Thomas P | $107,100 |
Source: Public Records
Tax History Compared to Growth
Tax History
| Year | Tax Paid | Tax Assessment Tax Assessment Total Assessment is a certain percentage of the fair market value that is determined by local assessors to be the total taxable value of land and additions on the property. | Land | Improvement |
|---|---|---|---|---|
| 2024 | $7,517 | $28,000 | $4,290 | $23,710 |
| 2023 | $5,638 | $28,000 | $4,290 | $23,710 |
| 2022 | $5,638 | $18,232 | $3,795 | $14,437 |
| 2021 | $5,837 | $19,491 | $3,795 | $15,696 |
| 2020 | $5,788 | $19,491 | $3,795 | $15,696 |
| 2019 | $5,673 | $19,458 | $3,465 | $15,993 |
| 2018 | $5,545 | $19,458 | $3,465 | $15,993 |
| 2017 | $5,357 | $19,458 | $3,465 | $15,993 |
| 2016 | $5,198 | $16,947 | $2,970 | $13,977 |
| 2015 | $5,053 | $16,947 | $2,970 | $13,977 |
| 2014 | $5,006 | $16,947 | $2,970 | $13,977 |
| 2013 | $5,645 | $19,963 | $2,970 | $16,993 |
Source: Public Records
Map
Nearby Homes
- 8948 Barberry Ln
- 9049 Barberry Ln
- 9101 Sycamore Dr
- 9012 W 89th St
- 8832 Pleasant Ave
- 9140 Sycamore Dr
- 9141 Meadowview Dr
- 8701 S Kean Ave
- Lot 8 S Kean Ave
- Lot 7 S Kean Ave
- Lot 6 S Kean Ave
- Lot 5 S Kean Ave
- Lot 4 S Kean Ave
- Lot 3 S Kean Ave
- Lot 2 S Kean Ave
- Lot 1 S Kean Ave
- 8601 S Kean Ave
- 9013 W 91st Place
- 8810 W 83rd Place
- 8506 S 85th Ct
- 8932 Sycamore Dr
- 8927 Barberry Ln
- 8938 Sycamore Dr
- 8921 Barberry Ln
- 8933 Barberry Ln
- 8730 Willow Rd
- 8724 Willow Rd
- 8939 Barberry Ln
- 8923 Sycamore Dr
- 8944 Sycamore Dr
- 8716 Willow Rd
- 8917 Sycamore Dr
- 8742 Beechnut Rd
- 8945 Barberry Ln
- 8913 Sycamore Dr
- 8950 Sycamore Dr
- 8748 Beechnut Rd
- 8749 Beechnut Rd
- 8951 Barberry Ln
- 8945 Sycamore Dr