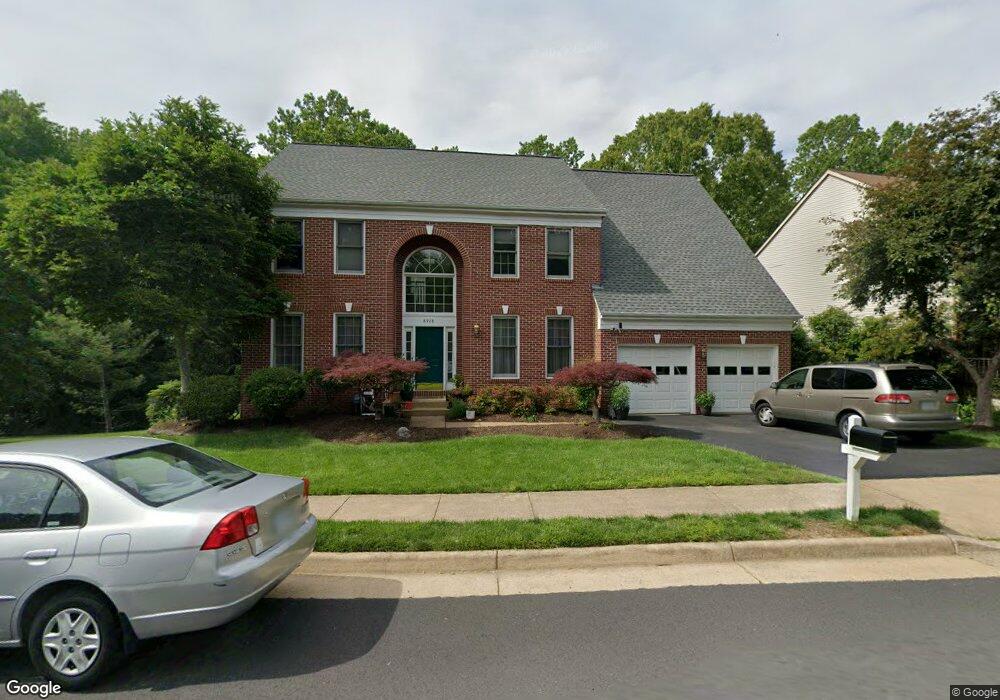
8928 Mountain Ash Dr Springfield, VA 22153
Estimated Value: $1,016,368 - $1,082,000
4
Beds
3
Baths
3,558
Sq Ft
$295/Sq Ft
Est. Value
About This Home
This home is located at 8928 Mountain Ash Dr, Springfield, VA 22153 and is currently estimated at $1,047,842, approximately $294 per square foot. 8928 Mountain Ash Dr is a home located in Fairfax County with nearby schools including Orange Hunt Elementary School, Irving Middle School, and West Springfield High School.
Ownership History
Date
Name
Owned For
Owner Type
Purchase Details
Closed on
Feb 16, 2024
Sold by
Tannheiser Dietmar B and Do Vanha T
Bought by
Tannheiser Dietmar B and Do Vanha T
Current Estimated Value
Purchase Details
Closed on
May 4, 2016
Sold by
Do Vanho and Tannheiser Doetar B
Bought by
Do Vanha D and Tannheiser Dietmar B
Home Financials for this Owner
Home Financials are based on the most recent Mortgage that was taken out on this home.
Original Mortgage
$200,000
Interest Rate
2.88%
Mortgage Type
New Conventional
Purchase Details
Closed on
Feb 27, 1995
Sold by
Centex Real Estate Corp
Bought by
Salmeron Victor M
Home Financials for this Owner
Home Financials are based on the most recent Mortgage that was taken out on this home.
Original Mortgage
$256,350
Interest Rate
9.17%
Create a Home Valuation Report for This Property
The Home Valuation Report is an in-depth analysis detailing your home's value as well as a comparison with similar homes in the area
Home Values in the Area
Average Home Value in this Area
Purchase History
| Date | Buyer | Sale Price | Title Company |
|---|---|---|---|
| Tannheiser Dietmar B | -- | None Listed On Document | |
| Tannheiser Dietmar B | -- | None Listed On Document | |
| Do Vanha D | -- | None Available | |
| Salmeron Victor M | $320,450 | -- |
Source: Public Records
Mortgage History
| Date | Status | Borrower | Loan Amount |
|---|---|---|---|
| Previous Owner | Do Vanha D | $200,000 | |
| Previous Owner | Salmeron Victor M | $256,350 |
Source: Public Records
Tax History
| Year | Tax Paid | Tax Assessment Tax Assessment Total Assessment is a certain percentage of the fair market value that is determined by local assessors to be the total taxable value of land and additions on the property. | Land | Improvement |
|---|---|---|---|---|
| 2025 | $11,728 | $1,022,920 | $315,000 | $707,920 |
| 2024 | $11,728 | $1,012,310 | $315,000 | $697,310 |
| 2023 | $10,227 | $906,240 | $285,000 | $621,240 |
| 2022 | $9,936 | $868,910 | $280,000 | $588,910 |
| 2021 | $9,211 | $784,950 | $250,000 | $534,950 |
| 2020 | $8,836 | $746,560 | $250,000 | $496,560 |
| 2019 | $8,468 | $715,510 | $245,000 | $470,510 |
| 2018 | $8,228 | $715,510 | $245,000 | $470,510 |
| 2017 | $7,983 | $687,590 | $235,000 | $452,590 |
| 2016 | $4,170 | $689,730 | $235,000 | $454,730 |
| 2015 | $7,642 | $684,730 | $230,000 | $454,730 |
| 2014 | $7,366 | $661,490 | $220,000 | $441,490 |
Source: Public Records
Map
Nearby Homes
- 8836 Shadowlake Way
- 7508 Irene Ct
- 7702 Newington Forest Ave
- 7604 Bertito Ln
- 8735 Stone Hill Place
- 8019 Galla Knoll Cir
- 7752 Gamid Dr
- 7217 Galgate Dr
- 9115 Northedge Dr
- 9104 Scott St
- 8739 Arley Dr
- 8108 Steeple Chase Ct
- 8301 Kings Ridge Ct
- 7105 Galgate Dr
- 8217 Bayberry Ridge Rd
- 9202 Rockefeller Ln
- 7140 Hamor Ln
- 8309 Linden Oaks Ct
- 7116 Hadlow Ct
- 7200 Beachway Ct
- 8926 Mountain Ash Dr
- 8925 Mountain Ash Dr
- 8927 Mountain Ash Dr
- 8924 Mountain Ash Dr
- 8929 Mountain Ash Dr
- 7700 White Willow Ct
- 8922 Mountain Ash Dr
- 7706 White Willow Ct
- 7710 White Willow Ct
- 7712 White Willow Ct
- 7716 White Willow Ct
- 7701 White Willow Ct
- 8920 Mountain Ash Dr
- 7718 White Willow Ct
- 7703 White Willow Ct
- 8919 Mountain Ash Dr
- 8938 Mountain Ash Dr
- 7597 Whisperwood Ct
- 7730 White Willow Ct
- 7709 White Willow Ct
Your Personal Tour Guide
Ask me questions while you tour the home.