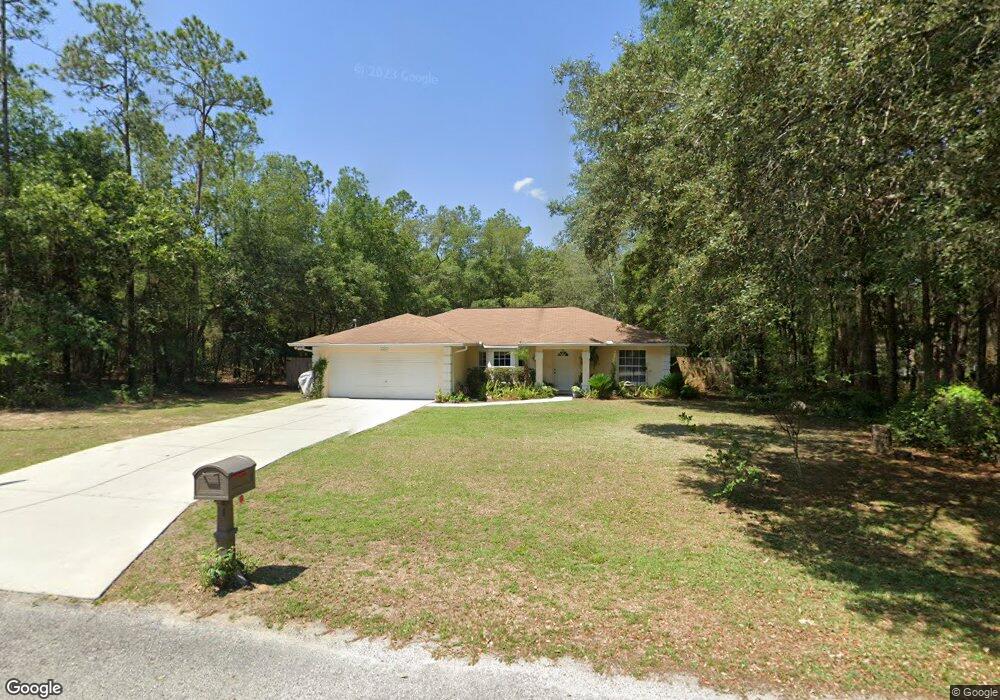
8928 N Spikes Way Dunnellon, FL 34434
Estimated Value: $210,473 - $282,000
3
Beds
2
Baths
1,506
Sq Ft
$171/Sq Ft
Est. Value
About This Home
This home is located at 8928 N Spikes Way, Dunnellon, FL 34434 and is currently estimated at $258,118, approximately $171 per square foot. 8928 N Spikes Way is a home located in Citrus County with nearby schools including Central Ridge Elementary School, Citrus Springs Middle School, and Citrus High School.
Ownership History
Date
Name
Owned For
Owner Type
Purchase Details
Closed on
Sep 14, 2015
Sold by
Gipe Alicia
Bought by
Page Kathryn R
Current Estimated Value
Purchase Details
Closed on
Feb 5, 2008
Sold by
Pav Peter A and Peter A Pav Trust
Bought by
Gipe Jeffrey L and Gipe Alicia
Home Financials for this Owner
Home Financials are based on the most recent Mortgage that was taken out on this home.
Original Mortgage
$127,200
Interest Rate
6.17%
Mortgage Type
Purchase Money Mortgage
Purchase Details
Closed on
Aug 11, 2004
Sold by
Brzozowski Marilyn A and Brzozowski Trust
Bought by
Pav Peter A and Peter A Pav Trust
Purchase Details
Closed on
Jul 6, 2000
Sold by
Brzozowski Marilyn A
Bought by
Brzozowski Marilyn A and Brzozowski Trust
Purchase Details
Closed on
Jul 1, 2000
Bought by
Page Kathryn R
Purchase Details
Closed on
Aug 1, 1979
Bought by
Page Kathryn R
Create a Home Valuation Report for This Property
The Home Valuation Report is an in-depth analysis detailing your home's value as well as a comparison with similar homes in the area
Home Values in the Area
Average Home Value in this Area
Purchase History
| Date | Buyer | Sale Price | Title Company |
|---|---|---|---|
| Page Kathryn R | -- | None Available | |
| Page Kathryn R | -- | None Available | |
| Gipe Jeffrey L | $133,900 | First American Title Ins Co | |
| Pav Peter A | $5,000 | Dba Crystal River Title | |
| Brzozowski Marilyn A | -- | -- | |
| Page Kathryn R | $100 | -- | |
| Page Kathryn R | $1,800 | -- |
Source: Public Records
Mortgage History
| Date | Status | Borrower | Loan Amount |
|---|---|---|---|
| Previous Owner | Gipe Jeffrey L | $127,200 |
Source: Public Records
Tax History Compared to Growth
Tax History
| Year | Tax Paid | Tax Assessment Tax Assessment Total Assessment is a certain percentage of the fair market value that is determined by local assessors to be the total taxable value of land and additions on the property. | Land | Improvement |
|---|---|---|---|---|
| 2025 | $640 | $64,762 | -- | -- |
| 2024 | $635 | $62,937 | -- | -- |
| 2023 | $635 | $61,104 | $0 | $0 |
| 2022 | $612 | $59,324 | $0 | $0 |
| 2021 | $601 | $57,596 | $0 | $0 |
| 2020 | $543 | $61,836 | $1,160 | $60,676 |
| 2019 | $531 | $55,524 | $1,240 | $54,284 |
| 2018 | $883 | $51,638 | $1,240 | $50,398 |
| 2017 | $828 | $46,960 | $1,050 | $45,910 |
| 2016 | $869 | $47,692 | $1,090 | $46,602 |
| 2015 | $290 | $36,600 | $1,090 | $35,510 |
| 2014 | $292 | $36,310 | $856 | $35,454 |
Source: Public Records
Map
Nearby Homes
- 9029 N Stern Dr
- 8991 N Ruby Way
- 8767 N Quarry Way
- 8566 N Spikes Way
- 8615 N Spikes Way
- 8782 N Sandee Dr
- 8782 N Sandree Dr
- 8576 N Stern Dr
- 8554 N Stern Dr
- 8587 N Stern Dr
- 9146 N Anton Way
- 9142 N Dawn Way
- 9134 N Dawn Way
- 0 E Anton Dr
- 435 W Union Place
- 9200 N Rhine Way
- 572 W Bluster Place
- 575 W Duquet Place
- 9208 N Rhine Way
- 589 W Duquet Place
- 9122 N Dawn Way
- 8921 N Quarry Dr
- 8897 N Quarry Dr
- 8968 N Spikes Way
- 8921 N Spikes Way
- 8947 N Spikes Way
- 8965 N Spikes Way
- 8987 N Spikes Way
- 8962 N Stern Way
- 8972 N Stern Dr
- 8988 N Stern Way
- 8971 N Quarry Dr
- 8972 N Ruby Way
- 8997 N Quarry Dr
- 0 US Highway 41
- 8982 N Ruby Way
- 8882 N Stern Way
- 8832 N Spikes Way
- 8981 N Ruby Way
- 8998 N Ruby Way