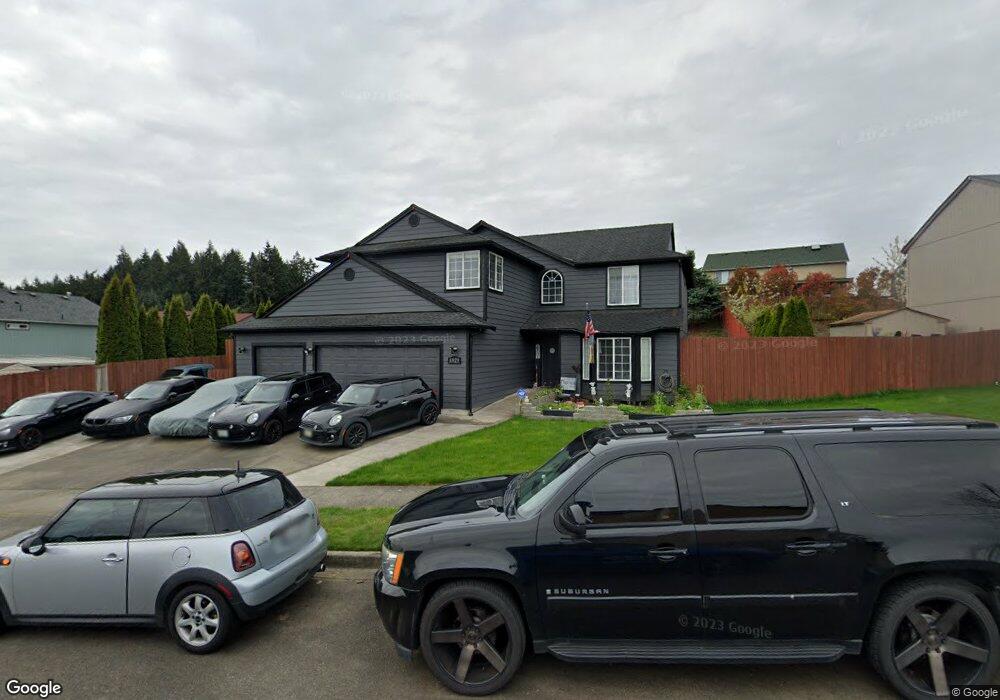
8929 Coos Dr SE Olympia, WA 98513
Meadows NeighborhoodEstimated Value: $610,000 - $680,000
5
Beds
4
Baths
2,690
Sq Ft
$235/Sq Ft
Est. Value
About This Home
This home is located at 8929 Coos Dr SE, Olympia, WA 98513 and is currently estimated at $631,369, approximately $234 per square foot. 8929 Coos Dr SE is a home located in Thurston County with nearby schools including Seven Oaks Elementary School, Nisqually Middle School, and River Ridge High School.
Ownership History
Date
Name
Owned For
Owner Type
Purchase Details
Closed on
Oct 6, 2011
Sold by
Mcmaster Matt H
Bought by
Vanness Rhea and Van Ness Brian
Current Estimated Value
Home Financials for this Owner
Home Financials are based on the most recent Mortgage that was taken out on this home.
Original Mortgage
$296,235
Outstanding Balance
$202,627
Interest Rate
4.16%
Mortgage Type
VA
Estimated Equity
$428,742
Purchase Details
Closed on
Sep 17, 2009
Sold by
Munoz Lynn L and Munoz Kimberly J
Bought by
Mcmaster Matt H
Home Financials for this Owner
Home Financials are based on the most recent Mortgage that was taken out on this home.
Original Mortgage
$288,369
Interest Rate
5.18%
Mortgage Type
FHA
Purchase Details
Closed on
Sep 28, 2001
Sold by
Lacey Land Associates Ltd Partnership
Bought by
Munoz Lynn L and Munoz Kimberly J
Home Financials for this Owner
Home Financials are based on the most recent Mortgage that was taken out on this home.
Original Mortgage
$199,971
Interest Rate
6.91%
Mortgage Type
VA
Create a Home Valuation Report for This Property
The Home Valuation Report is an in-depth analysis detailing your home's value as well as a comparison with similar homes in the area
Home Values in the Area
Average Home Value in this Area
Purchase History
| Date | Buyer | Sale Price | Title Company |
|---|---|---|---|
| Vanness Rhea | $290,000 | First American Title | |
| Mcmaster Matt H | $314,900 | Stewart Title Of Western Was | |
| Munoz Lynn L | $196,050 | First American Title |
Source: Public Records
Mortgage History
| Date | Status | Borrower | Loan Amount |
|---|---|---|---|
| Open | Vanness Rhea | $296,235 | |
| Previous Owner | Mcmaster Matt H | $288,369 | |
| Previous Owner | Munoz Lynn L | $199,971 |
Source: Public Records
Tax History Compared to Growth
Tax History
| Year | Tax Paid | Tax Assessment Tax Assessment Total Assessment is a certain percentage of the fair market value that is determined by local assessors to be the total taxable value of land and additions on the property. | Land | Improvement |
|---|---|---|---|---|
| 2024 | $5,055 | $557,700 | $147,000 | $410,700 |
| 2023 | $5,055 | $518,500 | $135,800 | $382,700 |
| 2022 | $5,129 | $522,000 | $78,000 | $444,000 |
| 2021 | $4,542 | $431,600 | $88,900 | $342,700 |
| 2020 | $4,204 | $355,600 | $87,200 | $268,400 |
| 2019 | $4,066 | $338,500 | $74,700 | $263,800 |
| 2018 | $4,703 | $339,500 | $54,700 | $284,800 |
| 2017 | $4,153 | $311,800 | $53,000 | $258,800 |
| 2016 | $3,706 | $297,200 | $49,700 | $247,500 |
| 2014 | -- | $272,700 | $48,800 | $223,900 |
Source: Public Records
Map
Nearby Homes
- 8905 Coos Dr SE
- 1314 Wakeman Ct SE
- 1215 Gadwell Ct SE
- 8810 Milbanke Dr SE
- 8839 Daffodil Ln SE
- 1425 Goldenrod Dr SE
- 8518 8th Ct SE
- 815 Gregory Way SE
- 8632 Graham Dr SE
- 8420 Sitka Ct SE
- 1433 Bedstone Dr SE
- 1434 Bedstone Dr SE
- 1226 Juniper Dr SE
- 541 Stonewood Dr SE
- 1436 Farina Loop SE
- 9115 Cherie Dr SE
- 9632 Pinedrop Dr SE
- 513 Hidden Forest Dr SE
- 727 Salzburg Ln SE
- 638 Bavarian Ln SE
- 8923 Coos Dr SE
- 1217 Milbanke Dr SE
- 1221 Milbanke Dr SE
- 8928 Chatham Ct SE
- 8934 Chatham Ct SE
- 1225 Milbanke Dr SE
- 8917 Coos Dr SE
- 1146 Bayenes Ct SE
- 8930 Coos Dr SE
- 8922 Chatham Ct SE
- 1229 Milbanke Dr SE
- 8935 Chatham Ct SE
- 8946 Coos Dr SE
- 8911 Coos Dr SE
- 1140 Bayenes Ct SE
- 8916 Chatham Ct SE
- 1233 Milbanke Dr SE
- 1222 Milbanke Dr SE
- 1218 Milbanke Dr SE
- 8927 Chatham Ct SE