
893 Cherokee Dr Bean Station, TN 37708
Estimated Value: $182,000 - $242,000
Highlights
- River Front
- 3.84 Acre Lot
- No Heating
- Lake View
- Level Lot
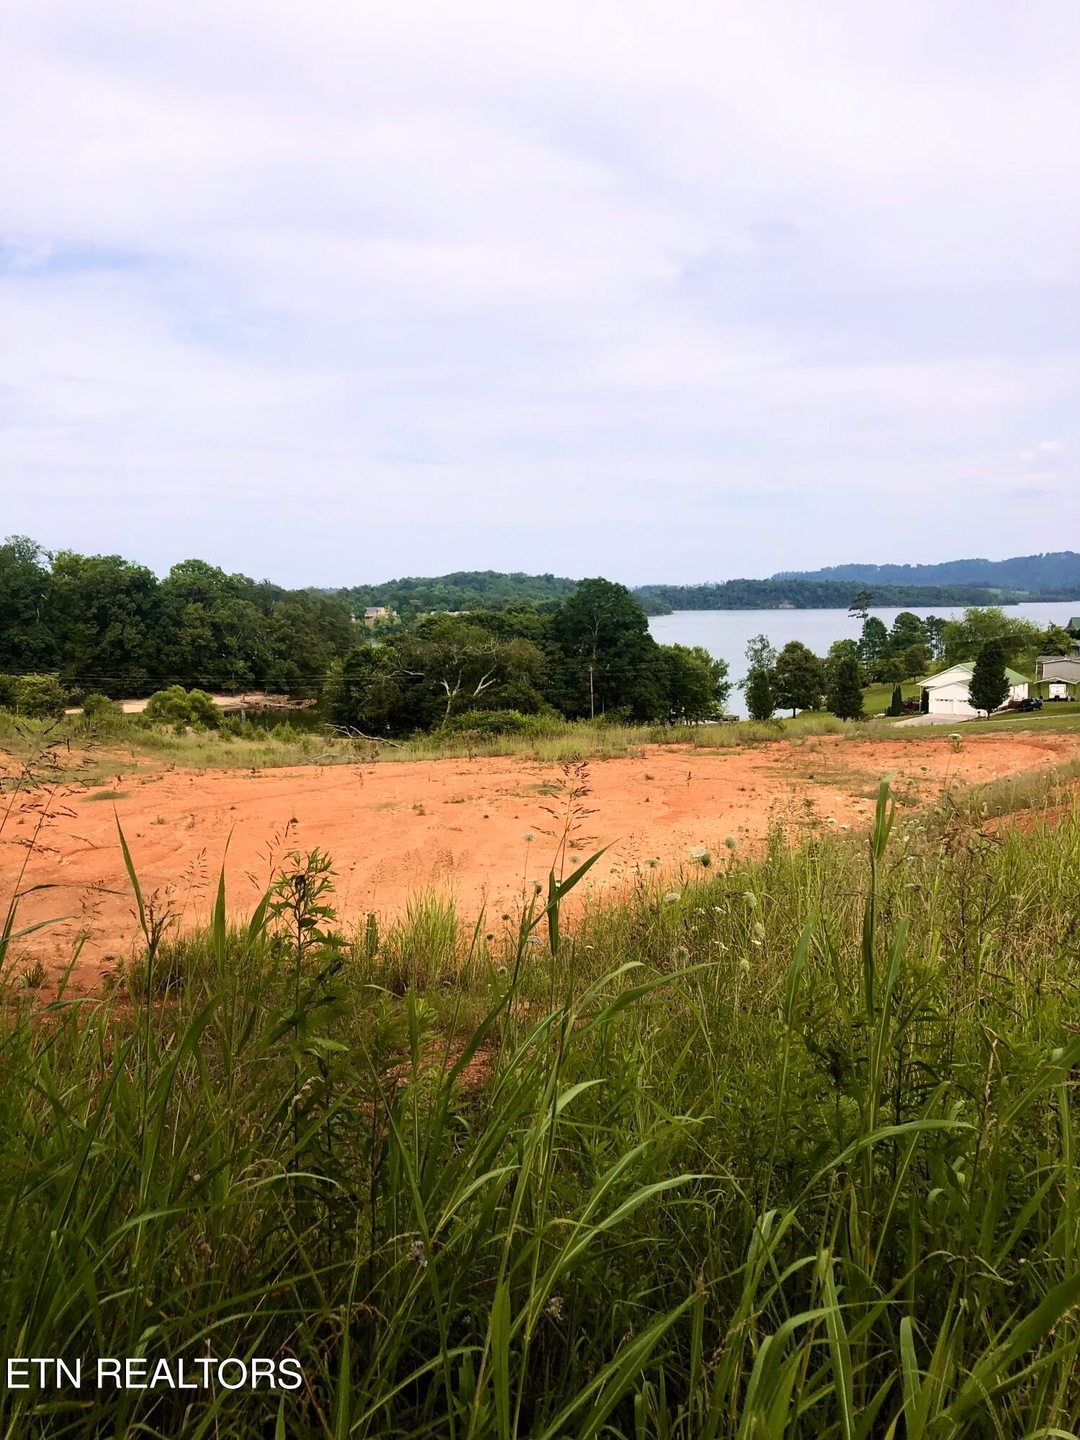
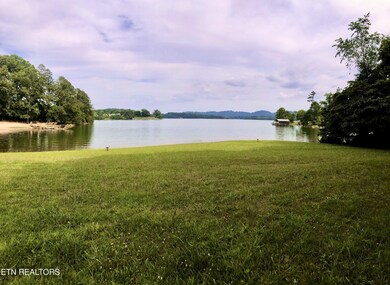
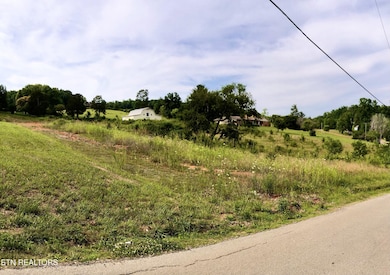
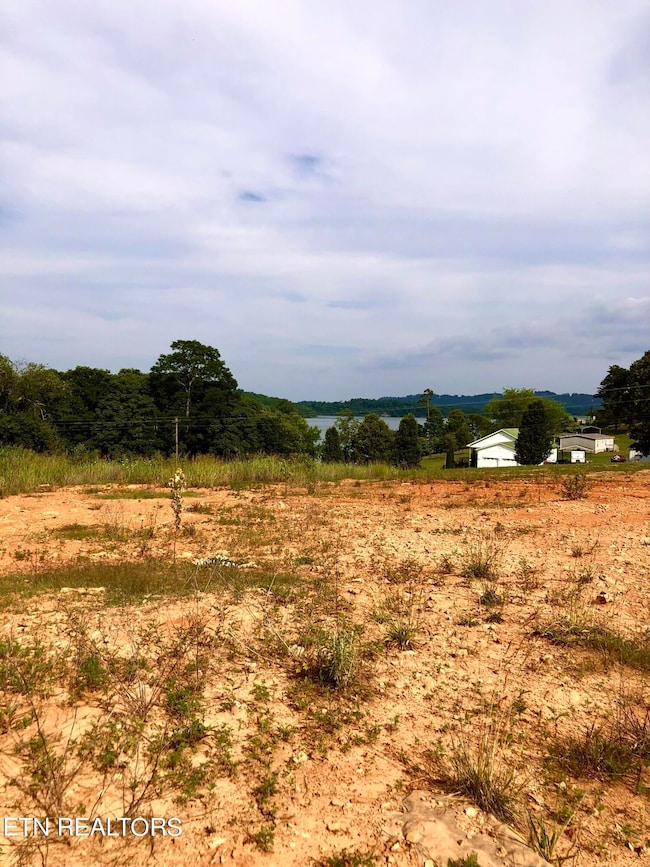
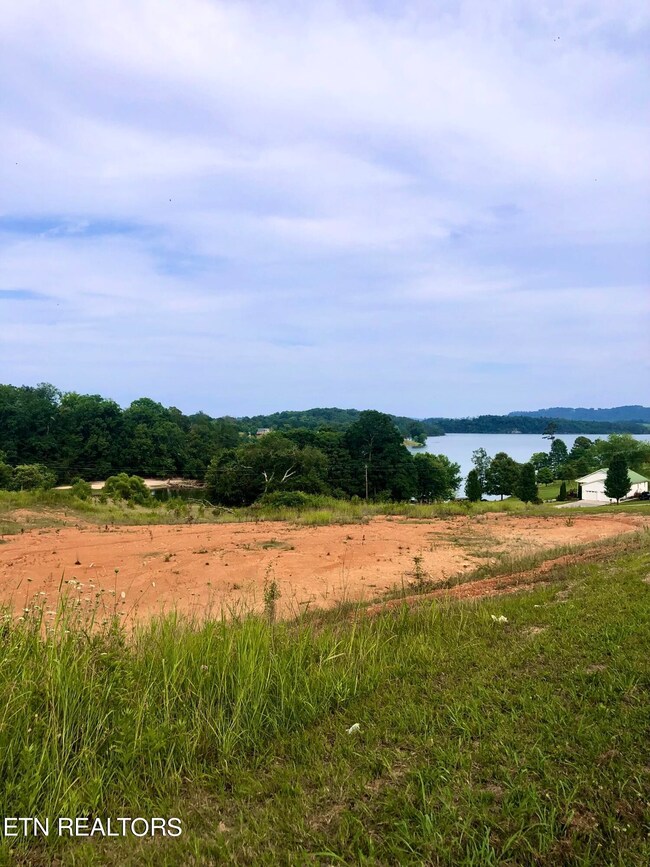
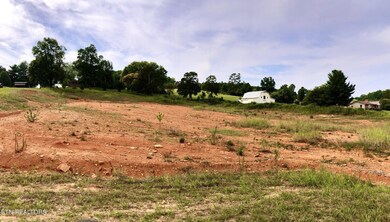
About This Lot
As of August 2024Almost 4 acres overlooking Cherokee lake in Grainger Co. The top of the lot has been levelled, allowing potential to place a home. Allows easy lake access. Close to Huffs German Creek marina.
Property Details
Property Type
- Land
Est. Annual Taxes
- $550
Lot Details
- 3.84 Acre Lot
- Lot Dimensions are 497x401x347x296
- River Front
- Property fronts a county road
- Level Lot
Property Views
- Lake Views
Listing and Financial Details
- Assessor Parcel Number 052 03301 000
Ownership History
Purchase Details
Home Financials for this Owner
Home Financials are based on the most recent Mortgage that was taken out on this home.Home Values in the Area
Average Home Value in this Area
Purchase History
| Date | Buyer | Sale Price | Title Company |
|---|---|---|---|
| Bentley Holdings Llc | $210,000 | Colonial Title | |
| Bentley Holdings Llc | $210,000 | Colonial Title |
Property History
| Date | Event | Price | List to Sale | Price per Sq Ft |
|---|---|---|---|---|
| 08/09/2024 08/09/24 | Sold | $210,000 | -8.7% | -- |
| 07/07/2024 07/07/24 | Pending | -- | -- | -- |
| 06/21/2024 06/21/24 | For Sale | $230,000 | -- | -- |
Tax History
| Year | Tax Paid | Tax Assessment Tax Assessment Total Assessment is a certain percentage of the fair market value that is determined by local assessors to be the total taxable value of land and additions on the property. | Land | Improvement |
|---|---|---|---|---|
| 2025 | $550 | $23,425 | $23,425 | $0 |
| 2024 | $550 | $23,425 | $23,425 | $0 |
| 2023 | $550 | $23,425 | $23,425 | $0 |
| 2022 | $538 | $23,425 | $23,425 | $0 |
| 2021 | $538 | $23,425 | $23,425 | $0 |
| 2020 | $656 | $23,425 | $23,425 | $0 |
| 2019 | $656 | $23,425 | $23,425 | $0 |
| 2018 | $567 | $23,425 | $23,425 | $0 |
Map
Source: Realtracs
MLS Number: 2832659
APN: 052-033.01
Disclaimer: Certain information contained herein is derived from information provided by parties other than Homes.com. All information provided is deemed reliable, but is not guaranteed to be accurate and should be independently verified.
![]() Based on information submitted to the MLS GRID. All data is obtained from various sources and may not have been verified by broker or MLS GRID. Supplied Open House Information is subject to change without notice. All information should be independently reviewed and verified for accuracy. Properties may or may not be listed by the office/agent presenting the information. Some IDX listings have been excluded from this website.
Based on information submitted to the MLS GRID. All data is obtained from various sources and may not have been verified by broker or MLS GRID. Supplied Open House Information is subject to change without notice. All information should be independently reviewed and verified for accuracy. Properties may or may not be listed by the office/agent presenting the information. Some IDX listings have been excluded from this website.
Based on information submitted to the MLS GRID
- 1804 Cherokee Dr
- 4066 Lakeshore Dr
- 215 Chickasaw Ln
- 424 Sandpiper Ln
- 433 Sandpiper Ln
- 432 Sandpiper Ln
- 314 Sandpiper Ln
- 344 Sandpiper Ln
- 112 Sandpiper Ln
- TBD Rhondas Way
- 12 Rhondas Way
- 1&2 Rhondas Way
- 329 Simpson Ln
- 164 Logans Bluff
- 120 Huckleberry Hollow Rd
- Lot 39 Logans Bluff
- 0 Paradise Mountain Ln Unit 1314541
- 1150 Oak Grove Rd
- 1 Megans Trail
- 141 Twin Church Rd
- 1039 Cherokee Dr
- 926 Cherokee Dr
- 833 Cherokee Dr
- 777 Cherokee Dr
- 1260 Cherokee Dr
- 784 Cherokee Dr
- 0 Kasihta Cir
- 735 Cherokee Dr
- 3819 Lakeshore Dr
- 204 Kasihta Cir
- 707 Cherokee Dr
- 869 Cherokee Dr
- 1184 Cherokee Dr
- 295 Kashinampoo Ln
- 112 Kasihta Cir
- 112 Koasati Rd
- 000 Catawba Rd
- 295 Koasati Rd
- Lot 112b Kashita Cir
- 470 Elkins Ridge
Ask me questions while you tour the home.