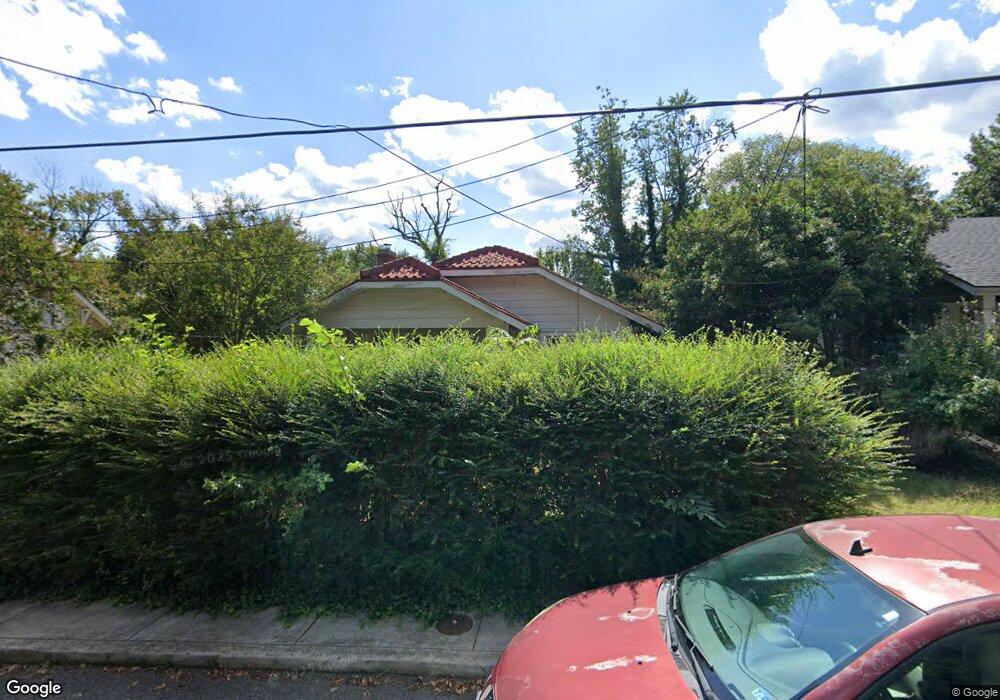
893 Dearing St Lynchburg, VA 24503
Daniel's Hill NeighborhoodEstimated Value: $106,000 - $139,000
2
Beds
1
Bath
1,263
Sq Ft
$99/Sq Ft
Est. Value
About This Home
This home is located at 893 Dearing St, Lynchburg, VA 24503 and is currently estimated at $125,647, approximately $99 per square foot. 893 Dearing St is a home located in Lynchburg City with nearby schools including Bedford Hills Elementary School, Linkhorne Middle School, and E.C. Glass High School.
Ownership History
Date
Name
Owned For
Owner Type
Purchase Details
Closed on
Feb 4, 2008
Sold by
Miller Anthony B
Bought by
Webb Ethan G
Current Estimated Value
Home Financials for this Owner
Home Financials are based on the most recent Mortgage that was taken out on this home.
Original Mortgage
$71,405
Outstanding Balance
$44,458
Interest Rate
5.9%
Mortgage Type
FHA
Estimated Equity
$81,189
Purchase Details
Closed on
Oct 6, 2006
Sold by
Crowder Glenda Willis
Bought by
Miller Anthony B
Create a Home Valuation Report for This Property
The Home Valuation Report is an in-depth analysis detailing your home's value as well as a comparison with similar homes in the area
Home Values in the Area
Average Home Value in this Area
Purchase History
| Date | Buyer | Sale Price | Title Company |
|---|---|---|---|
| Webb Ethan G | -- | Southern Title Realty Agency | |
| Miller Anthony B | -- | None Available |
Source: Public Records
Mortgage History
| Date | Status | Borrower | Loan Amount |
|---|---|---|---|
| Open | Webb Ethan G | $71,405 |
Source: Public Records
Tax History Compared to Growth
Tax History
| Year | Tax Paid | Tax Assessment Tax Assessment Total Assessment is a certain percentage of the fair market value that is determined by local assessors to be the total taxable value of land and additions on the property. | Land | Improvement |
|---|---|---|---|---|
| 2025 | $773 | $92,000 | $20,000 | $72,000 |
| 2024 | $660 | $74,200 | $15,000 | $59,200 |
| 2023 | $660 | $74,200 | $15,000 | $59,200 |
| 2022 | $701 | $68,100 | $9,000 | $59,100 |
| 2021 | $756 | $68,100 | $9,000 | $59,100 |
| 2020 | $683 | $61,500 | $6,000 | $55,500 |
| 2019 | $683 | $61,500 | $6,000 | $55,500 |
| 2018 | $664 | $59,800 | $6,000 | $53,800 |
| 2017 | $664 | $59,800 | $6,000 | $53,800 |
| 2016 | $664 | $59,800 | $6,000 | $53,800 |
| 2015 | $664 | $57,700 | $3,000 | $54,700 |
| 2014 | $640 | $60,900 | $3,000 | $57,900 |
Source: Public Records
Map
Nearby Homes